The Cost of Raising a Child in the UK: The Number, and the Bits the Number Leaves Out
What raising a child really costs in the UK, from childcare and Child Benefit to university, private school and lost earnings, and how to model your own number.
A long-read planning briefing, roughly an hour
A Few Quid is not authorised or regulated by the FCA. This article is general information, not advice.
There is a number everyone quotes. A quarter of a million pounds to raise a child to eighteen. It comes from the Child Poverty Action Group (CPAG), whose 2025 report puts the basic cost at around £250,000 for a couple and £290,000 for a lone parent, and it is a real figure built from a careful basket of what a child needs for a minimum acceptable life. It is also, for the purpose of planning your own finances, almost useless on its own. It is a population minimum, not your number. It includes childcare but parks rent and council tax to one side. And it leaves out the two things that actually move a family's net worth the most, the bigger home you buy to fit everyone in and the years of earnings a parent gives up. The real shape of the cost of a child is not one number. It is a shape, front-loaded by childcare, stretched by a mortgage you took on partly for the extra bedroom, and tailed by university and the long help into adulthood that fewer young people can now skip.
This guide builds that shape from the parts. The current UK figures for Child Benefit, childcare, statutory pay, student loans and the rest, each checked against the source and the right tax year, because most of them changed at the last Budget. The traps that turn a manageable cost into a cliff, the High Income Child Benefit Charge and the £100,000 thresholds chief among them. The decisions that dwarf all of it, whether a parent steps back from work, whether you pay for private school, whether university pays off. And throughout, the difference between the cash a child costs and the wealth a child costs, because a pound spent on nursery at age one is not a pound, it is the several pounds it would have become by the time you needed it.
A Few Quid is not authorised by the Financial Conduct Authority (FCA). This article is general information, not advice. Nothing here is a personal recommendation. For decisions about pensions, investments or tax, speak to a regulated financial adviser who can look at your whole situation.
How to read this guide
This is a long read, so here is the route before you set off, from the softest inputs to the hardest outputs.
We start with what the cost of a child actually means, because the famous quarter-million figure measures something narrower than most people think, and the gap between cash cost and wealth cost decides how to read every number that follows. Then the timeline begins. The first year and the income shock covers the birth, the kit and the cliff in household income that statutory pay creates. The childcare cliff is the single biggest line in the early years, and the chapter that has changed most, so it gets the current nursery costs, the funded hours and the support you can stack on top.
Then the tax traps. Child Benefit and the high-income trap explains the charge that turns a pay rise into a loss, and the £100,000 cliff that takes your childcare help with it. The day-to-day cost as they grow walks the spend from toddler to teenager and picks up the political thread, the two-child limit now being scrapped. The extra bedroom nobody budgets for is the housing cost that dwarfs the nappies, and the one the headline studies leave out.
The middle of the guide is about the cost that lands on you rather than on the child. The cost that lands on the parents is the lost earnings and the pension gap of a career break, the largest hidden number in the whole exercise. Then university in two parts. The bill and the debt sets out tuition, maintenance and the debt your child will actually leave with. Is the degree worth it is the deep dive, the graduate premium, the one-in-five who lose out, the subjects that pay and those that do not, the rise of the student living at home, and the politics of fees and loans.
Then the big optional cost. Private school against the index fund runs the comparison head to head, fees paid versus fees invested and handed over as a deposit. After that, the building chapters. Saving and investing for your child covers the Junior Individual Savings Account, gifting and the eighteen-year compounding window, with a flag on a tax change landing in 2027. The order of operations settles the question parents agonise over, your retirement or their deposit.
Two worked examples then run real numbers, in today's money, on the same couple both times, once where two incomes absorb the cost and once where a career break roughly doubles it, with a full grid of every combination of the dials. A chapter on the horizon stretches the view from age eighteen to your own retirement, where the picture changes again. A closing chapter on how to actually decide pulls it together, and the guide ends with a note on who built this and why.
1. What the cost of a child actually means
Ask three sources what a child costs and you get three answers that are not even measuring the same thing.
The Child Poverty Action Group's Cost of a Child in 2025 puts it at roughly £250,000 for a couple and £290,000 for a lone parent, to age eighteen. That figure rests on the Minimum Income Standard, a budget researched at Loughborough University from what ordinary people agree a household needs for a minimum acceptable standard of living. It is deliberately a floor for an adequate life, not an average of what families spend, and it includes childcare while keeping rent and council tax separate. A lone parent costs more because one adult cannot share the fixed costs that two can. The couple figure actually fell, from about £260,000 in the 2024 report to £250,000 in 2025, almost entirely because the funded-childcare expansion cut what working parents pay. That single movement tells you how much of this total is childcare and how much policy can shift it.
A second, older lens comes from the insurer LV= and the Centre for Economics and Business Research, whose long-running series reached about £230,000, but to age twenty-one rather than eighteen, including university tuition and excluding private school. It is a broader, longer figure on a different basis. You cannot add it to the CPAG number, and the rough closeness of the two is a coincidence of different end-ages cancelling different baskets.
So the first thing to fix is that there is no single true cost, only a measure and a basis. For planning your own money, the measure that matters is not a national basket at all. It is the effect of a child on your own net worth over time, which has three layers the published studies mostly miss.
The first layer is the cash a child costs you, the nursery bills, the food, the shoes, the school trips. The second is the cost you take on around the child without it ever appearing in a "cost of a child" line, chiefly a bigger home and the earnings a parent steps away from. The third is opportunity cost, the growth that all of that money would have produced had it stayed invested. A pound of nursery fees at age one, left in a global tracker instead, could be three pounds by the time the child leaves university. The cash cost and the wealth cost are different animals, and confusing them is why "£250,000" feels both enormous and, somehow, not enough to explain why parents feel poorer than the figure suggests.
This is why the guide treats the cost of a child as something you build rather than look up. The chapters that follow are the components. The worked examples near the end assemble them, in today's money, into the only figure worth acting on, the dent in your projected wealth, on your numbers.
2. The first year and the income shock
The first year has two costs that pull in opposite directions, and most new parents feel the second one far more than the first.
The visible cost is the kit and the birth. Surveys from insurers and brokers put the first year somewhere between £6,000 and £12,000, with a frequently cited figure around £8,500, covering the cot, the pram, car seats, clothes, nappies and the rest. Treat those numbers with care, because the firms publishing them often sell baby products or insurance, and the basket is whatever they chose to price. The genuinely useful point underneath is that the one-off setup cost, while real, is the smaller half of the first-year story and the part you can most control by buying second-hand and accepting hand-me-downs.
The cost that actually reshapes the year is the drop in household income while a parent is on leave. Statutory Maternity Pay (SMP) runs for up to 39 weeks. The first six weeks pay 90% of average earnings, but the remaining 33 weeks pay the lower of 90% of earnings or a flat rate, which is £194.32 a week in the 2026/27 tax year. For anyone earning more than about £11,000 a year, those 33 weeks are a steep cut, and the final 13 weeks of the year of leave are usually unpaid altogether. Statutory Paternity Pay covers just two weeks at the same flat rate, which is why the second parent's leave rarely makes a dent in the income gap. Maternity Allowance fills in for those who do not qualify for SMP, at the same flat weekly figure.
The shape of the hit, then, is a household running on close to two incomes, dropping to roughly one-and-a-bit for a couple of months, then to one income plus a few hundred pounds a month, then often to a single income for the unpaid stretch. Families who plan only for the baby kit and not for that income valley are the ones who reach for a credit card in month eight.
You can run the precise take-home figures in the salary calculator, which applies the current personal allowance, National Insurance and tax bands rather than a rule of thumb. The point of doing it before the birth is that the buffer is far easier to build on two incomes than to claw back on one.
3. The childcare cliff
For most working families childcare is the single largest cost of a young child, and it arrives all at once, in the years before school, exactly when one income may already be reduced. It is also the part of the system that has changed the most, so old advice and old numbers are actively misleading here.
Start with the unsupported price, because it shows the size of the problem. The Coram Family and Childcare survey for 2025 put a full-time nursery place for a child under two at about £239 a week in England for families eligible for funded hours, and roughly £105 a week more for families who are not yet eligible. Part-time costs vary sharply by nation, around £70 a week in England for eligible families but far higher in Scotland and Wales, which run their own schemes. Across a year, an unsupported full-time place can run well into five figures per child, and two children in nursery at once can cost more than a parent's entire take-home salary. That last fact is the engine behind the career-break decision in a later chapter.
Against that sits a stack of support, and the order you claim it matters.
The biggest piece in England is the funded-hours scheme. From September 2025 the expansion completed, so eligible working parents now get 30 funded hours over 38 weeks a year from when the child is nine months old until they start school. To qualify, each parent must earn at least the equivalent of 16 hours a week at the minimum wage, and, the catch that catches high earners, each must have an adjusted net income under £100,000. Thirty hours over 38 weeks is not the same as 30 hours every week, because nurseries open about 51 weeks a year, so most families still pay for the wraparound hours and the holiday weeks. The funded hours cut the bill hard, but they rarely remove it.
On top of the hours sits Tax-Free Childcare, which adds £2 for every £8 you pay into a childcare account, up to £2,000 a year per child, or £4,000 for a disabled child. The same £100,000 cliff applies. Lower-income families on Universal Credit instead use its childcare element, which refunds up to 85% of costs within monthly caps of about £1,032 for one child and £1,769 for two or more, but you cannot run Tax-Free Childcare and Universal Credit childcare support at the same time, so the right one depends on your income.
The practical lesson is that childcare is a short, brutal spike, not a permanent cost, and that the support is real but conditional and front-loaded with cliffs. Knowing where the £100,000 line sits, and what a pension contribution does to it, is worth more than any amount of switching nursery for a cheaper one.
4. Child Benefit and the high-income trap
Child Benefit is the one payment almost every family with children can claim, and the rules around it are a small masterpiece of unintended consequences.
The payment itself is straightforward. In the 2026/27 tax year it is £27.05 a week for the eldest or only child and £17.90 a week for each additional child, paid every four weeks. Over eighteen years the eldest child alone brings in more than £25,000 at current rates, which is not nothing against the cost of raising them. Even families who expect to lose it to the high-income charge should usually still claim, ticking the box to receive the payment or, if they prefer, to register without payments, because the claim is what protects a parent's National Insurance record through the years at home and secures the child a National Insurance number automatically.
The complication is the High Income Child Benefit Charge (HICBC). Once the higher earner in the household has an adjusted net income over £60,000, the charge claws back 1% of the Child Benefit for every £200 of income above that line, so it is fully recovered at £80,000. The thresholds rose from £50,000 in April 2024, which softened the trap, and a proposal to assess it on household income from 2026 was dropped, so it remains based on the single highest individual income.
That individual basis produces the rule's strangest feature. Two parents earning £59,000 each, a household on £118,000, keep every penny of Child Benefit. A single earner on £80,000, or a couple where one earns £80,000 and the other nothing, keep none. The system is blind to household income at exactly the point where household income is what pays for the child. It is unfair in a way successive governments have acknowledged and not fixed, and it is worth understanding precisely because the fix is sometimes in your hands.
The lever is adjusted net income, which is income after pension contributions and Gift Aid. A higher earner on £67,000 who puts £7,000 into a pension brings their adjusted net income to £60,000 and recovers the full Child Benefit, on top of the income tax relief on the contribution. For a family with two or three children, the recovered benefit can make a pension contribution one of the highest-returning uses of money available, before the pension has grown a penny.
The £100,000 trap, the worst marginal rate in Britain
Sixty thousand pounds is the first trap. One hundred thousand is the one that should make any parent of young children stop and check their payslip, because it stacks three penalties on the same pound of income and produces what is, for parents, the highest effective tax rate in the country.
The base of it applies to everyone, children or not. Between £100,000 and £125,140 of income, the personal allowance, the £12,570 everyone otherwise earns tax-free, is withdrawn at £1 for every £2 earned. Losing that allowance on top of paying 40% tax on the income means every extra pound in that band is taxed at an effective 60%. Earn £1,000 more and keep £400. That alone is a strong reason for high earners to pension down below £100,000.
For a parent of pre-school children, it gets far worse, because £100,000 of adjusted net income is also the cliff where the funded childcare hours and Tax-Free Childcare both vanish, as covered in the chapter on childcare costs. Not taper, vanish, the moment the line is crossed. The table below stacks what happens to income in each band for a household with young children.
| Income band (higher earner) | What each extra pound meets |
|---|---|
| £50,271 to £60,000 | Higher-rate income tax at 40% |
| £60,000 to £80,000 | 40% tax plus the High Income Child Benefit Charge clawing the benefit back |
| £100,000 to £125,140 | 40% tax plus the personal allowance withdrawal, an effective 60% rate |
| The moment income tops £100,000 | All of the above, plus the funded hours and Tax-Free Childcare lost in one step |
For a parent of two young children, crossing £100,000 can mean a 60% marginal income tax rate and the loss of childcare support worth well over £10,000 a year at the same instant. The combined effect is that a pay rise from £99,000 to £105,000 can leave a family materially worse off than before it. The effective marginal rate on that income, once lost childcare is counted, can exceed 100%, one of the few places in the tax system where earning more genuinely costs you money.
The fix is the same lever as the £60,000 line, only larger. A pension contribution that brings adjusted net income back below £100,000 restores the personal allowance and the childcare support together, so the true value of the contribution is the tax relief plus the recovered allowance plus the reinstated funded hours and top-up. For a parent caught just above the line, that can be one of the highest-returning financial moves available to anyone, and it is invisible to a family who does not know the cliff is there.
5. The day-to-day cost as they grow
Strip out childcare and university and what is left is the long, steady middle, the food, the clothes, the shoes outgrown every term, the birthday parties, the phone, the school uniform, the trips, the hobbies. It is less dramatic than the nursery spike, but it runs for eighteen years and it climbs as the child gets older.
The pattern in the Minimum Income Standard basket, and in most families' experience, is that the day-to-day cost is lowest in the early school years and highest in the teens. A toddler eats little and wears cheap clothes. A fifteen-year-old eats like an adult, wants the same phone as their friends, and costs more to clothe, feed and entertain than a primary-age child by a wide margin. The teenage years also bring the costs that feel optional until they are not, the school trip everyone else is going on, the sports kit, the driving lessons. Modelling a flat per-year figure across childhood understates the back half badly.
There is also a structural cost the day-to-day basket only hints at, which is the loss of household economies of scale. A second child does not cost the same as the first. Some things are shared or handed down, which pulls the per-child cost down, but housing, holidays and time are stretched thinner, which pushes the household total up. The Cost of a Child research captures this in the gap between one child and two, and in the larger gap for lone parents who cannot share fixed costs with a second adult at all.
This is also where the cost of children meets politics most directly. The two-child limit, introduced in 2017, capped the child element of Universal Credit at the first two children, denying support of up to £3,514 a year for each additional child. The Child Poverty Action Group estimated it affected around 1.6 million children in 450,000 households, and it was the single biggest driver of child poverty in the official figures. Following the Autumn Budget 2025 the limit is being removed from April 2026, a reversal of years of resistance, at a cost the government put at over £2 billion a year and an estimated 450,000 fewer children in relative poverty. The detailed mechanics are still being finalised through the Child Poverty Strategy, so anyone affected should check gov.uk for how it applies to their claim. For lower-income families with three or more children, this is the largest single change to the cost of children in years.
For families above the means-tested system, the relevant political backdrop is the long freeze on tax thresholds, now extended to April 2031. The personal allowance and the higher-rate threshold have been frozen since April 2021, so every pay rise drags more income into tax and pushes more parents toward the £60,000 and £100,000 cliffs that govern Child Benefit and childcare support. The cost of children is rising not only because prices rise, but because frozen thresholds steadily raise the real tax on the families paying for them.
6. The extra bedroom nobody budgets for
Here is the cost that beats every other line in this guide for most families, and the one the famous studies deliberately exclude. A child needs somewhere to sleep, and that somewhere is usually a more expensive home.
The Cost of a Child figures set rent and council tax aside, for a defensible reason, because housing costs vary so wildly by region and tenure that including them would make any single national figure meaningless. But for your own plan, housing is not a footnote, it is often the main event. A couple in a one-bedroom flat who have two children will, at some point, buy or rent a three-bedroom home. The difference between those two homes, over the decades you hold the larger one, is a cost of having children even though no nursery or school is involved, and it routinely runs into six figures.
It shows up in several ways at once. A larger deposit, which is money taken out of investments or saved instead of invested. A larger mortgage, which means more interest paid over the life of the loan. Higher running costs, more council tax, more to heat, more to maintain. And often a move further out for space or schools, trading commute for square footage in a way that has its own price in time and travel. None of this appears in "£250,000 to eighteen", yet for a family that trades up specifically to house the children, the extra housing cost over the years can rival the entire day-to-day cost of raising them.
What the extra bedroom costs in London
Put a number on it and the abstraction disappears. In London, where the average home runs around £553,000, roughly twice the United Kingdom average of £270,000 according to the Office for National Statistics, the step from a two-bedroom flat to a three-bedroom one is its own small fortune. Market data from property analysts puts the typical London two-bed flat near £585,000 and the three-bed near £820,000, a gap of about £235,000 for the extra room. The table sets out the London picture in today's money.
| In London | Typical figure |
|---|---|
| Average home, all types | About £553,000, roughly twice the UK average |
| Two-bedroom flat | About £585,000 |
| Three-bedroom flat | About £820,000 |
| The step from two bedrooms to three | About £235,000 |
| Each extra bedroom, to rent | About £600 to £700 a month, or £7,000 to £8,000 a year |
Read those figures with the right caveat. The overall averages and the rents come from the Office for National Statistics, but a clean London price by bedroom count is not something it publishes, so the £585,000 and £820,000 are market estimates from property analysts rather than official statistics, and they describe flats, where houses and boroughs vary widely. A more cautious cross-check using floor area, a double bedroom of around twelve to fourteen square metres at London's typical £7,400 a square metre, values the room itself nearer £90,000 to £105,000. The full step-up sits well above that because buying a third bedroom usually means a different postcode and a different tier of property, not just more floor space. Either way the cost is large. Finance £235,000 over a typical mortgage and the interest roughly doubles it across the term, so in London the extra bedroom can, on its own, cost more than the entire day-to-day spend the Child Poverty Action Group counts for the child who sleeps in it. To rent rather than buy, the same room adds something like £7,000 to £8,000 a year, every year, for as long as the family needs the space.
There is a subtler version too, the home you do not downsize from. Plenty of parents stay in a family-sized house long after the children have left, partly from inertia and partly from the wish to have somewhere for them to come back to, which the boomerang-generation chapter will show is increasingly the reality. That retained space is a continuing cost of children long after they are adults, paid in tied-up equity, maintenance and council tax on rooms standing empty.
You can model the trade-up in the mortgage calculator and then place it inside your whole plan in the what-if simulator, so the bigger home sits alongside the childcare years and the reduced income rather than being considered in isolation. Considered alone, an upgrade looks like a lifestyle choice. Considered against the rest of the family budget, it is frequently the decision that determines whether the plan holds.
7. The cost that lands on the parents
Every cost so far has been money spent on the child. This one is different. It is the money the parents never earn, and for many families it is the largest number in the entire calculation, larger than childcare, larger than university, larger than the house.
When a parent reduces their hours or leaves work during the childcare years, the household loses that income directly. That much is obvious. What is less obvious, and far larger, is everything that travels with the lost salary. The pension contributions that stop, both the parent's own and the employer's match. The pay rises and promotions that do not happen during the years out or part-time, which permanently lower the salary the parent returns to, an effect documented well enough to have a name, the motherhood penalty, since it falls overwhelmingly on women. And the compounding, because a pension contribution missed at thirty-two has more than three decades to grow, and the growth it never produces is part of the cost.
Consider the shape of it. A parent who drops to half-time for six years gives up not six years of half a salary, but six years of half a salary, plus six years of pension contributions and their employer match, plus a permanently lower earnings trajectory afterwards, plus the lifetime of investment growth all of that would have produced. Set against it is the childcare those years save, which is real but smaller. The career break can be the right call for a family for reasons that have nothing to do with money, but the financial cost of it is routinely underestimated by a factor of several, because people count the lost wages and forget the pension and the compounding.
This is the gap between the published "cost of a child" and the real hit to a household's wealth. The CPAG basket counts what you spend on the child. It cannot count what a parent stops earning, because that depends entirely on the choices and careers of the two adults. Yet in the worked examples later in this guide, moving a single dial, whether one parent steps back, changes the lifetime cost more than the number of children does. The pension calculator is the quickest way to put a figure on the contribution half of that cost.
The hidden cost of lost sleep
There is one more cost that lands on the parents, and it appears on no spreadsheet because it is paid in hours of sleep rather than pounds. The evidence that it carries a price, though, is surprisingly solid.
Start with how much sleep children actually cost. A 2019 study in the journal Sleep, led by researchers at the University of Warwick and following more than 4,600 parents, found that sleep does not return to its pre-pregnancy level until around six years after the first child is born. The hit is worst in the first three months, when mothers lose about an hour a night and fathers around fifteen minutes, and it narrows but does not close for years afterward. A higher household income did nothing to protect against it. The summary is at ScienceDaily.
Now the part that turns lost sleep into lost money. The economists Matthew Gibson and Jeffrey Shrader, in a 2018 paper in the Review of Economics and Statistics, used the timing of sunset across time-zone boundaries as a natural experiment to isolate the effect of sleep on pay, sidestepping the obvious chicken-and-egg problem. They found that a one-hour increase in average weekly sleep raised wages by around 1.1% in the short run and roughly 5% over the longer run. Sleep, on this evidence, is an input to earnings, and less of it shows up in the pay packet. The working paper sets out the method.
Chain those two findings and the implication for parents is uncomfortable. Children reduce parental sleep for years, and reduced sleep lowers earnings, so part of the career cost in the section above may run through sheer exhaustion rather than only through hours cut or promotions missed. Treat that as a reasonable inference rather than a measured fact, because no single study follows the path from night wakings to a smaller pay rise end to end, the wage study is American, and the sleep study is observational. The direction is not in much doubt, and it is corroborated at the edges. Sleep-deprived people have been shown in lab experiments to make more risk-tolerant financial choices, though the effect varies by person and task. And RAND Europe has estimated that insufficient sleep costs the UK economy up to £40 billion a year, about 1.86% of national output.
The practical point is modest but real. Protecting sleep in the early years, by sharing the night wakings, accepting help, and not wearing exhaustion as a badge, is not only a health matter. It plausibly protects the household's earning power at the exact moment money is tightest, which makes it part of the cost of children worth managing rather than simply enduring.
8. University part one: the bill and the debt
For families whose children go to university, the late-teen years bring a fresh wave of cost, structured very differently from everything before it because most of it is borrowed by the child, not paid by the parent. That does not make it free. It reshapes the family's finances in ways worth understanding before the offers arrive.
The headline costs come in two parts. Tuition fees in England are capped at £9,535 a year for 2025/26, the first rise since 2017 and now legislated to keep rising with inflation. Maintenance loans, meant to cover living costs, reach up to about £13,762 a year for a student living away from home in London and around £10,544 outside it. Add three years and the borrowing alone tops £60,000 for many students, before any contribution from parents. The result is that the average debt at the point of entering repayment was about £53,000 in the 2024 to 2025 financial year, and the total outstanding student loan balance in England has passed £266 billion and is forecast to keep climbing for two decades.
The repayment system is where the real economics sit, and it is genuinely different for today's students. Under Plan 5, which covers English students who started from 2023, graduates repay 9% of income above a £25,000 threshold, the balance is written off 40 years after repayment begins, and interest is capped at the Retail Prices Index measure of inflation rather than carrying a real-rate surcharge. The low threshold and the long term change who pays. Under the previous Plan 2, the Institute for Fiscal Studies (IFS) estimated only around half of borrowers would ever clear their loans. Under Plan 5, with its lower threshold and longer write-off, the IFS expects around four in five to repay in full. The loan has shifted from something most graduates partly escaped to something most will carry for nearly all their working lives.
That is why describing the loan as a debt in the ordinary sense misleads in both directions. It does not behave like a credit card, because the repayment is income-contingent and what remains is eventually written off, so a graduate who earns little pays little and a graduate who never earns much may pay nothing extra at all. But for the large majority who now repay in full, it behaves like an extra 9% tax on income above £25,000 for decades, which is a substantial and lasting cost even though it never appears as a bill.
You can model the repayments in the student loan calculator on the salary the graduate might realistically earn, which is the clearest way to judge whether overpaying or avoiding the loan is worth the cash, or whether that money would do more as a house deposit instead.
9. University part two: is the degree worth it
The bill is only half the question. The other half is whether the degree pays for itself, and here the evidence is far less reassuring than the "graduates earn more" headline suggests, because the average hides enormous variation.
Start with the average, because it is real. Department for Education figures for 2024 put the median salary for working-age graduates at around £42,000, against £30,500 for non-graduates, with postgraduates higher still at about £47,000, and graduate employment rates well above non-graduate ones. The detailed IFS work on lifetime earnings, controlling for the fact that people who go to university would have earned more anyway, found an average net lifetime gain after tax and student loan repayments of roughly £130,000 for men and £100,000 for women, a meaningful return on three years and a loan.
Then look underneath the average, where the comforting story falls apart. The same IFS analysis found that about one in five students would have been no better off financially, and possibly worse off, for having gone to university at all. Roughly 85% of women and around three-quarters of men come out ahead, which means a substantial minority do not. The variation by subject is vast. Studying economics or medicine lifted lifetime earnings by something like 30% or more against a baseline, while creative arts, social care and a handful of other subjects showed returns near zero or negative for some students. Five years after graduating, the gap is already stark, with economics and medicine graduates around £40,000 and creative arts, social care and media graduates nearer £20,000. The question "is a degree worth it" is almost meaningless. The real question is whether a specific degree, at a specific institution, for a specific student, is worth it, and for a fifth of students the answer is no.
This matters for parents in two ways. It reframes any help toward university as an investment with a wide range of outcomes, not a guaranteed step up, and it argues for weighing the course and the career it leads to rather than the prestige of going. It also means the most valuable thing a parent can offer is often not money but a clear-eyed conversation about which degrees, and which alternatives such as apprenticeships, actually pay.
Two trends are reshaping the picture further. The first is the rise of the student living at home. Data from the University and College Admissions Service, analysed by the Higher Education Policy Institute, shows around 35% of first-year UK students intended to live in the parental home in 2025, up from about 33% in 2016, with the preference rising fastest among the youngest applicants. Living at home removes the single biggest cost of university, rent, which is why it is growing as fees and living costs climb. It shifts cost back onto parents in the form of a longer full house, but it can cut the child's debt and living costs dramatically.
The second is the broader boomerang effect. The Office for National Statistics reported that 28% of young adults aged 20 to 34 lived with their parents in 2024, up from about 26% a decade earlier, some 3.6 million people, and markedly higher for young men than young women. The cost of children, in other words, increasingly does not stop at 18 or even 21. Many parents now provide housing, or subsidise it, well into their child's twenties, a cost no eighteen-year horizon captures and one that has grown directly out of housing being unaffordable on a young person's income.
The political backdrop frames all of this. Tuition fees have begun rising again after a long freeze, with further inflation-linked increases legislated. The loan system was tightened under Plan 5 in a way the IFS calculated would leave lower-earning graduates worse off than under the old system while higher earners pay less, shifting the burden down the income scale. And the government still expects not to recover a large slice of what it lends, the figure known as the Resource Accounting and Budgeting charge, which means the taxpayer, the graduate and the parent are all paying for higher education in different and contested proportions. None of this changes the core advice to a family, which is to treat a specific degree as an investment to be appraised, not a rite of passage to be funded automatically.
10. Private school against the index fund
No single discretionary decision moves a family's finances like private school, so it deserves a head-to-head with the obvious alternative, investing the same money and handing it to the child later. This is a comparison about money only. The case for private education rests on teaching, environment, networks and values, none of which a spreadsheet can price, and a family may judge those worth any amount. But to weigh them you need to see clearly what the money alone could do, because the sum is far larger than most parents realise.
The fees first. The Independent Schools Council's 2025 census put the average day-school fee at about £18,500 a year before Value Added Tax (VAT). Since January 2025, private school fees carry 20% VAT, a policy that raised fees by something closer to 10% to 15% in practice once schools absorbed part of it through reclaimed input VAT. Use a post-VAT day fee of around £20,000 a year in today's money as a working figure. Held flat in real terms, educating one child privately from reception to eighteen comes to about £280,000 in today's money, and around £355,000 in the actual pounds you would hand over as fees keep pace with inflation, in line with independent estimates. Boarding costs roughly twice that.
Now the alternative. Take that same fee and, instead of handing it to a school, invest it in a global index fund inside a tax-free wrapper. The return usually quoted for equities is around 7% a year after inflation. Treat that as the real, after-inflation return, the way the rest of this guide treats returns, so the pots below are already in today's money and are not shrunk again for inflation. In the nominal terms a fund factsheet shows, 7% after inflation is roughly 9%. That is broadly the long-run US real equity return, with global equities a little lower at around 5% real, according to the UBS Global Investment Returns Yearbook. The table runs both, 7% real as the headline and 5% real as a more cautious bracket, because the right number for your family depends on the return you actually believe. Both come from the model in this guide's accompanying script, and both are in today's money.
The tax-free wrapper is doing real work in these numbers. A Junior Individual Savings Account shelters up to £9,000 a year per child with no tax on the growth, and a parent's own £20,000 Individual Savings Account allowance can hold the rest, so the whole of a redirected £20,000 fee can sit beyond the reach of tax. At eighteen the Junior Individual Savings Account becomes the child's own and can roll straight into an adult one, where it carries on compounding with no tax on growth, dividends or withdrawals. Outside a wrapper, tax on dividends and gains would steadily erode the return, which is why this comparison assumes the money stays sheltered.
| What you do with the fee money | At 7% after inflation | At 5% after inflation |
|---|---|---|
| Pay the fees, reception to 18 | About £280,000 spent | About £280,000 spent |
| Invest it instead, value by age 18 | About £483,000 | About £412,000 |
| Leave it invested tax-free to age 21 | About £591,000 | About £476,000 |
| Leave it invested tax-free to age 30 | About £1.09 million | About £739,000 |
Read the table slowly, because the figures are large enough to mislead if skimmed. Paying the fees spends about £280,000 of today's money and leaves the child with an education. Investing the identical stream instead is worth roughly £483,000 by the time they turn eighteen at the 7% real return, or about £412,000 at the more cautious 5%, either way comfortably more than the £280,000 in fees, because the money compounds while the fees are simply spent. Then the wrapper keeps working. Left invested rather than spent, the pot reaches around £591,000 by twenty-one and, by age thirty, the point many people are scraping together a first deposit, about £1.09 million at 7% after inflation or about £739,000 at 5%. The distance between those last two figures is the risk in the assumption, and the argument for modelling a return you actually believe rather than the one the headline quotes.
So the genuine trade is not "good school versus index fund". It is "a private education" against "a house, outright, handed to your adult child, plus whatever non-financial value the local state school delivers for free". Reasonable families decide that both ways. The point of putting the numbers side by side is to make the decision a real one rather than a default, and to retire the idea that the fees are the whole cost. The fees are the cash cost. The house your child does not get is the opportunity cost, and it is the larger of the two.
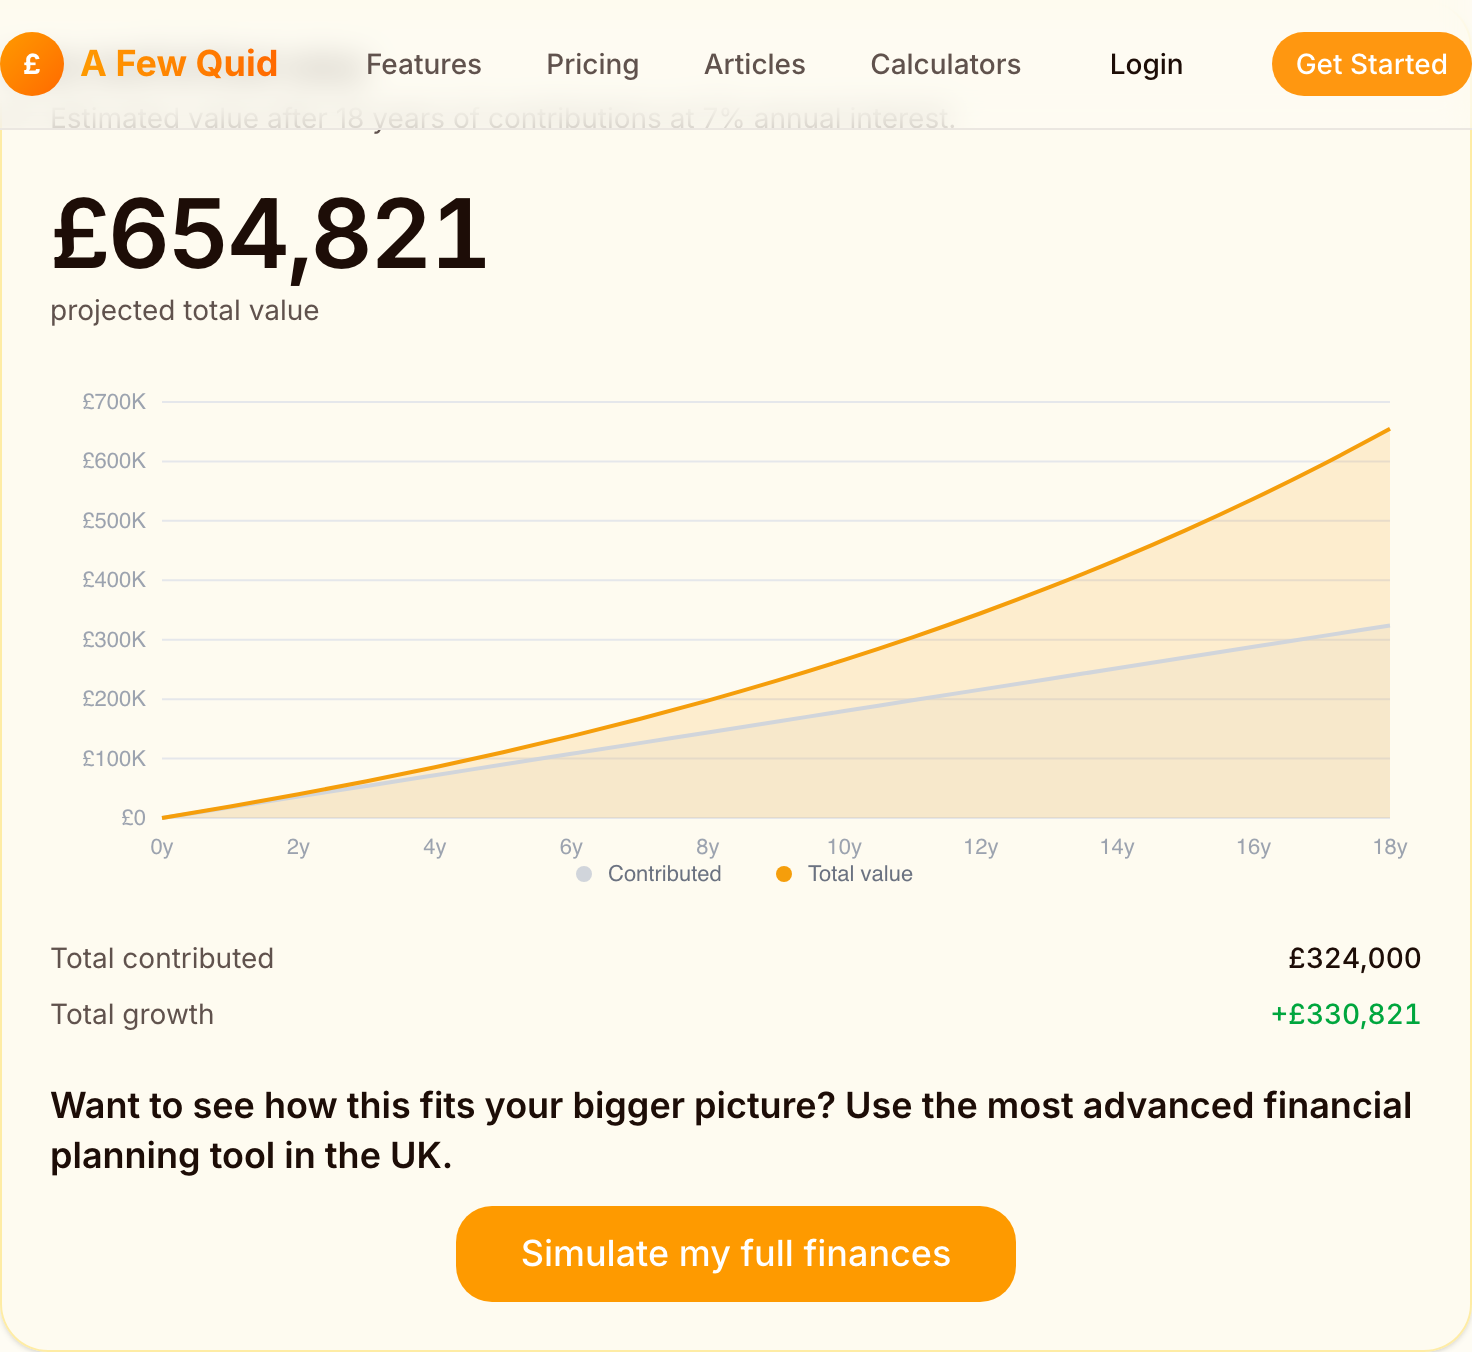
The calculator below runs a round version you can reproduce, £1,500 a month, roughly a year's day-school fee, invested at a 7% after-inflation return from birth for eighteen years. Because the 7% is treated as a real return, the £654,821 it lands on is already in today's money. It runs higher than the table because it invests across the full eighteen years from birth rather than the fourteen school years.
You can reproduce the comparison on your own fee level and return assumptions in the compound-interest calculator, and then see how either path sits inside your whole financial life, including your own retirement, in the dashboard. The decision deserves both lenses, the standalone sum and the place it occupies in everything else you are funding.
11. Saving and investing for your child
Set against all this cost is the other side of the ledger, the saving and investing parents do for a child, where the long time horizon turns even modest amounts into meaningful sums. The eighteen years between birth and adulthood are precisely the runway that makes compounding work, which is why money set aside early for a child does disproportionate work.
The main dedicated wrapper is the Junior Individual Savings Account (Junior ISA, or JISA). A parent or guardian opens and manages it, but the child legally owns it and gains full control at eighteen. The annual allowance is £9,000, separate from an adult's own £20,000 Individual Savings Account (ISA) allowance, and all growth, dividends and interest are tax-free. A child can hold a Junior ISA or a Child Trust Fund but not both, and the older Child Trust Funds, set up for children born between 2002 and 2011, are now maturing, with hundreds of thousands of eighteen to twenty-three year olds sitting on unclaimed accounts worth an average of around £2,200. If your child was born in that window, checking for a forgotten Child Trust Fund is a quick job worth doing.
The choice within the wrapper matters as much as the wrapper. Cash savings for a newborn feel safe but, over eighteen years, are likely to lose to inflation in real terms. A stocks and shares Junior ISA carries the ups and downs of markets but has the one thing that makes equity risk worth taking, time, which is exactly what an eighteen-year horizon provides. The handover at eighteen is the catch worth thinking about in advance, because the money becomes the child's to spend on anything, deposit or sports car alike, and there is no parental veto.
Some parents go further and start a pension for their child, into which up to £2,880 a year attracts basic-rate tax relief that grosses it up to £3,600, and which then has not eighteen but sixty years to compound before the child can touch it. The sums involved by retirement are extraordinary precisely because the runway is so long, though the money is locked away until the child's own retirement age, which most parents weigh against the more flexible Junior ISA.
Larger transfers of family wealth bring inheritance tax into view, and the rules reward planning. Each person can give away £3,000 a year free of inheritance tax, with one year's unused allowance carried forward, plus unlimited small gifts of £250 to different people, plus regular gifts out of surplus income that do not affect your standard of living. Larger one-off gifts fall outside the estate entirely if the giver survives seven years. Grandparents funding a Junior ISA or a house deposit are using these allowances whether they realise it or not, and using them deliberately can move significant sums to children and grandchildren free of tax.
You can model a Junior ISA in the ISA calculator and compare an eighteen-year horizon with the much longer one of a child's pension in the compound-interest calculator, which is the clearest way to see why time, not the amount, is the lever that matters most when saving for a child.
12. The order of operations
Once a family has children, the saving questions multiply, and they compete for the same limited money. Your pension or their Junior ISA. The mortgage or the school fees. Your retirement or their deposit. There is a defensible order to these, and it rests on a single idea, that you cannot borrow for your retirement but your child can borrow for almost everything else.
The logic runs roughly like this, though the right order for any family depends on their numbers. First comes anything that is close to free money, the employer pension match you forgo by not contributing enough, and the tax relief and restored benefits that come from keeping adjusted net income below the £60,000 and £100,000 cliffs. These are the highest returns available anywhere, often before any investment growth at all. Second comes expensive debt, because clearing a debt costing more than you can reliably earn investing is a guaranteed return. Third comes your own long-term retirement saving, funded to the point where your own future is secure on realistic assumptions. Only after those does saving for a child's deposit or education usually earn its place, not because children do not matter, but because every other goal can be borrowed for and your retirement cannot.
This order feels uncomfortable to many parents, because the instinct is to put the children first in money as in everything else. But the instinct can impoverish two generations at once, the parent who under-funds their pension during the expensive years and reaches retirement short, and the adult child who then has to support them. Securing your own retirement first is not the selfish choice, it is the one that protects the child from a far larger future cost. The aeroplane rule, fit your own oxygen mask before helping others, holds because a parent who runs out of money in old age becomes their children's most expensive liability.
None of this means ignoring the children's future. It means sequencing. A family that captures the full employer match, stays the right side of the income cliffs, clears expensive debt and funds a realistic retirement can then pour what is left into a Junior ISA or a deposit fund with a clear conscience, knowing the help they give is help they can afford. The order is what makes the generosity sustainable.
You can put the competing goals in front of the optimiser, which ranks them by projected outcome on your inputs, and then watch the winning order play out across the decades in the dashboard. The sequence that looks obvious in the abstract is not always the one your own numbers favour, which is the whole reason to model it.
13. Worked example: the cost two incomes absorb
Time to assemble the parts into a single number, and to do it the only way that means anything, on a specific family, in today's money. The two worked examples that follow are the same couple. Two thirty-two-year-olds, one earning £55,000 and one £35,000, both below the £60,000 Child Benefit line and the £100,000 childcare cliff, living in England with access to the funded hours. Between this example and the next, three dials move, the number of children, whether one parent steps back to part-time, and the investment return their freed money could have earned. Whatever changes the answer, it is not the family.
One rule before the figures, because it governs how to read all of them. Everything is in today's money. Inflation is assumed at 2%, in line with the Bank of England target, and stripped out of every return, so a "7% real" return is roughly 9% in the nominal terms a fund factsheet would show, and the more cautious "5% real" is about 7% nominal. The headline figures below use 7% real, in line with the long-run US equity return and the rate this guide uses for the private-school comparison, with 5% real shown alongside as a more cautious lower bracket, because the right number for your family depends on the return you actually believe. The cost measured is not the cash spent but the dent in the household's projected net worth, which is the cash spent plus the growth that cash would have earned had it stayed invested. That is what a baseline-versus-scenario comparison in the what-if simulator shows, and it is the figure that actually changes a plan.
| Input | Value |
|---|---|
| Parents | Two aged 32, earning £55,000 and £35,000 |
| Children | One |
| Childcare | Both parents full-time, England funded hours, Tax-Free Childcare |
| Child Benefit | Retained in full (higher earner under £60,000) |
| Investment return | 7% real headline, 5% real lower bracket |
| Horizon | The child's 18th birthday |
This couple's direct, out-of-pocket spend on one child, the childcare, food, clothes and the rest but not housing, comes to about £246,000 before Child Benefit and £221,000 after, which lands squarely on the Child Poverty Action Group's £250,000 minimum. So far, the headline number holds up.
The dent in their net worth is larger, and this is the point the headline misses. Because that £221,000 is spent over eighteen years rather than all at once, and because the early childcare years are the heaviest, the money given up has years to have grown. Invested instead at the 7% real return this guide uses, the same stream of outflows would have become about £442,000 in today's money by the child's eighteenth birthday, or about £359,000 at the more cautious 5% real. The £221,000 is the cash. The £442,000, or £359,000 on the sober assumption, is the cost to their wealth, and the gap between the cash and the dent is the growth the spending never produced.
Why does this family absorb it comfortably? Because both incomes keep running. There is no career break, so no lost salary, no pension gap, no permanently lower earnings trajectory. The cost is real and large, but it is the cost of the child alone, not the cost of the child plus a parent's career. The next example moves exactly that dial.
14. Worked example: the cost a career break doubles
Same couple. Same ages, same salaries, same region, same inflation adjustment. Now turn the three dials, and watch the cost roughly double, then double again.
| Dial | Two incomes absorb it | A career break doubles it |
|---|---|---|
| Number of children | One | Two, two years apart |
| Working pattern | Both full-time | Lower earner half-time for six years |
| Investment return | 7% real | 7% real |
None of the new settings is exotic. Two children spaced two years apart is among the most common family shapes in Britain. One parent dropping to half-time through the pre-school years, when two children in nursery can cost more than that parent's take-home pay, is a decision hundreds of thousands of families make for exactly that reason. And the return is held steady at 7% real so that the change is attributable to the family's choices, not the market.
The result is severe. The gross outflow rises, because two children cost more than one and because the lost earnings and paused pension contributions of the part-time parent are added in. But the dent in net worth rises far faster, because the lost income lands in the early years and so has the longest time to compound. Against the one-child, two-income figure of £442,000, this family's cost to their net worth by the first child's eighteenth birthday is about £949,000 in today's money at 7% real, or £773,000 at 5% real, more than double either way. The second child adds cost. The career break, with its lost salary, lost pension and lost compounding, adds more than the second child does.
The grid below stacks every combination of the three dials, always the same couple, in today's money, with the net-worth dent measured at the first child's eighteenth birthday. Each row comes from the model in this guide's accompanying script.
| Children | Working pattern | Investment return | Net-worth dent at 18 |
|---|---|---|---|
| One | Both full-time | 5% real | £359,000 |
| One | Both full-time | 7% real | £442,000 |
| One | One half-time | 5% real | £490,000 |
| One | One half-time | 7% real | £616,000 |
| Two | Both full-time | 5% real | £683,000 |
| Two | Both full-time | 7% real | £828,000 |
| Two | One half-time | 5% real | £773,000 |
| Two | One half-time | 7% real | £949,000 |
Read the dials one at a time. The number of children is the biggest single lever, roughly doubling the dent from one child to two across every pairing, because a second child carries almost the full cost of the first with only modest savings from shared clothes and toys. The working pattern is the next, and it does more damage at higher returns, because the lost income and pension contributions compound harder when the freed money would have grown faster. The investment return is the multiplier on everything, turning the same spending into a larger or smaller foregone fortune. Notice that the cheapest scenario, one child with both parents working at the cautious 5% return, costs about £359,000, while the most expensive, two children with a long career break at the 7% return, costs about £949,000, more than two and a half times as much, and the family in both is identical.
One row deserves its own table, the midpoint between the two brackets. Take the same two children and the same six-year half-time break, but a 6% real return, roughly 8% nominal, halfway between the cautious and headline ends.
| Children | Working pattern | Investment return | Out-of-pocket spend | Net-worth dent at 18 |
|---|---|---|---|---|
| Two | One half-time | 6% real (8% nominal) | £476,000 | £856,000 |
This row carries a caution about the model itself, the kind worth naming rather than hiding. The net-worth dent assumes that every pound not spent on the children would otherwise have been invested and left untouched at the stated return. Few families would really have invested all of it, so the true cost sits somewhere between the out-of-pocket figure and the full dent, nearer the dent for a diligent saver and nearer the cash for a family who would have spent the money anyway. The fair reading of this middle row is therefore a bracket, £476,000 of cash given up, which costs the household's wealth as much as £856,000 once foregone growth at the midpoint return is counted, with your own position depending on how much of that money you would genuinely have invested. The bracket, not a single false-precise number, is the truth.
15. The horizon: to eighteen against to retirement
Every figure so far stops at the child's eighteenth birthday, because that is where the cost-of-a-child studies stop. The trouble is that the cost of children, and especially the cost of the choices made around them, does not stop there. Stretch the horizon to the parents' own retirement and two things change the picture entirely.
The first is that the same outflows, given another two or three decades to compound, grow into far larger foregone sums. The one-child, two-income family whose cost reached £442,000 by the child's eighteenth birthday sees that figure, measured instead at the parents' age sixty-five, grow to roughly £1.2 million in today's money at the 7% real return, or about £747,000 at a more cautious 5% real, because the money given up in the childcare years would have spent another thirty-plus years compounding. The two-child family with a career break reaches about £2.7 million at 7% real, and £1.6 million even at 5%. These are not predictions that you will be millions of pounds poorer, they are a way of seeing that money diverted in your thirties is not money you spent, it is money that never got to work for your sixties. The career break does its real damage not at eighteen but at sixty-five, through the pension that was never built.
The second is that the costs themselves now run well past eighteen. The boomerang generation is not a slogan, it is 28% of young adults living with their parents, university debts that act as a decades-long payroll deduction, and house deposits that take parental help to assemble. The "cost to eighteen" framing made sense when a child left at eighteen for a job or a cheap rented flat and was financially independent by their early twenties. For a large share of families that world is gone. The help into a deposit, the spare room held open, the contribution to a wedding or a grandchild, are real costs that the tidy eighteen-year number simply does not see.
This is the strongest argument for modelling the cost of children inside your whole financial life rather than as a standalone budget. A childcare bill looks survivable in isolation and looks different sitting next to the pension it crowds out and the deposit you may want to help with fifteen years later. The lifetime view and the to-eighteen view can disagree sharply about which decision matters most, and when they disagree, the lifetime view is the one that determines whether you retire comfortably.
16. How to actually decide
The first answer is the practical one. Put your real numbers into a thorough, UK-specialised financial calculator and work out your own situation, because every family's is different. The same couple in this guide cost their net worth about £360,000 in one scenario and close to £950,000 in another, and no article can know which one is yours. A tool that holds your salaries, your region's childcare costs, your saving rate and your retirement goal, and that understands Child Benefit, the income cliffs, student loans and UK tax, settles in an evening what a generic average never will. Get started with A Few Quid.
If you want to interrogate the decision yourself first, the rest of this guide reduces to a handful of questions. Answer them straight and most of the planning follows.
Where do the income cliffs fall for you? Find each parent's adjusted net income after pension contributions, and see how close the higher earner sits to £60,000 and £100,000. Those two lines govern Child Benefit and the whole childcare-support stack, and a pension contribution that moves you below one of them can be worth more than the contribution itself.
What is the real childcare bill, after the funded hours, in your years and your area? This is the spike that breaks budgets, and it is short. Model the actual two or three tight years, not an eighteen-year average, so you can see the squeeze in the context of the decades around it.
If a parent steps back, what is the full cost, not just the lost wages? Add the lost salary, the paused pension and its employer match, the lower trajectory afterwards, and the compounding on all of it, then set the childcare saved against it. The financial cost of a career break is usually several times the lost wages alone, and it lands hardest on the retirement pot.
For university and private school, is this specific choice worth its specific cost? A degree pays on average and fails to pay for about one in five students, with subject choice swinging the result by hundreds of thousands. Private school fees buy an education or, invested, a house. Neither is a default to fund automatically, both are investments to appraise.
Is your own retirement secured before you fund theirs? You can borrow for a deposit or a degree, you cannot borrow for your old age, and a parent who runs short in retirement becomes the child's largest future cost. Sequencing your own security first is what makes helping them sustainable.
Then run it, on your numbers, stressed both ways. The what-if simulator prices a single decision in minutes, the optimiser ranks the competing claims on your money, and the dashboard keeps the whole projection alive as salaries, childcare costs and your own plans change, because this is not a decision you make once. The family that revisits the numbers each year catches the pay rise that crosses a cliff, the childcare bill that ends, the moment the deposit fund can finally take priority.
About the author and this calculator
I am Mike Gallagher, based in the UK, and I built A Few Quid because the tools I could find for questions like this one handed out averages instead of answers. The cost of a child is the worst example of it. Every figure I read was either a national minimum that bore no relation to my own situation, or a scary headline number with no working shown, and none of them could tell me what a child would actually do to my plan, against my salary, my childcare costs and my retirement goal.
A Few Quid is the tool I wanted. It runs UK-specific projections on your real inputs, from a single what-if scenario to a full household plan with salary, pension, ISA, mortgage and children interacting across decades. It knows the current Child Benefit rates, the income cliffs, the student loan system and the tax bands, and it shows its working. I am not a financial adviser, and A Few Quid is not authorised by the FCA, which I state plainly because it matters. The app is a calculator for exploring your own numbers, not a source of personal advice. For decisions the size of private school fees or a career break, paid professional advice is worth its fee.
If this guide leaves you with one habit, make it this. Treat every cost-of-a-child figure you meet, the famous quarter-million and the worked examples above alike, as someone else's inputs wearing a conclusion. The numbers here are accurate as of June 2026 and sourced below, but rates change, reliefs lapse, and your family is not the example. Build your own number from your own parts, stress it until it holds, and then decide. That is the only version of this answer worth having.
FAQ
How much does it cost to raise a child to 18 in the UK?
The Child Poverty Action Group's Cost of a Child 2025 report puts the basic cost at around £250,000 for a couple and £290,000 for a lone parent, to age 18, on a minimum acceptable standard of living. That total includes childcare but treats rent and council tax separately, and it is a floor, not an average. It also leaves out the cost of a bigger home and the earnings a parent gives up, which for many families are larger than the day-to-day spend. Your own number depends on childcare, where you live and how you work, so it is worth modelling rather than copying.
Is the two-child benefit cap being scrapped?
Yes. The two-child limit, which had capped the Universal Credit child element at the first two children since 2017, is being removed following the Autumn Budget 2025, taking effect from April 2026. The Child Poverty Action Group estimated the cap affected about 1.6 million children in 450,000 households, each additional child losing up to £3,514 a year. The detailed mechanics are being finalised, so check gov.uk for how it applies to your claim.
What is the High Income Child Benefit Charge and when do I lose Child Benefit?
The High Income Child Benefit Charge claws back Child Benefit once the higher earner in the household has an adjusted net income over £60,000. The charge is 1% of the benefit for every £200 of income above £60,000, so it is fully removed at £80,000. It is based on the highest individual income, not the household total, which produces the odd result that two parents earning £59,000 each keep all of it while a single earner on £80,000 keeps none. A plan to assess it on household income was dropped in 2024.
Is private school worth it compared with investing the fees?
It depends on what you are buying. The average private day-school fee is about £18,500 a year before Value Added Tax (VAT), which since January 2025 adds up to a fifth on top. Paying day-school fees from reception to 18 costs around £280,000 in today's money. Invest that same money tax-free at a 7% return after inflation instead and it could be worth over £480,000 by the time the child turns 18, and more than £1 million if left invested to age 30. The trade is academic and social, not financial. Model both paths on your own fee level and a return you actually believe in.
How much is childcare in the UK and what help is available?
A full-time nursery place for a child under two averaged about £239 a week in England in 2025 for families eligible for funded hours, and far more for those who are not. The main support in England is 30 funded hours for working parents from when the child is nine months old, fully rolled out from September 2025, plus Tax-Free Childcare worth up to £2,000 a year per child. Scotland, Wales and Northern Ireland run different schemes. Both the funded hours and Tax-Free Childcare disappear if either parent's adjusted net income tops £100,000.
How much student debt will my child leave university with?
Average debt at the point of entering repayment was about £53,000 in the 2024 to 2025 financial year, and is forecast to keep rising. Under the Plan 5 system for students who started from 2023, repayments are 9% of income above £25,000, written off after 40 years, with interest capped at the Retail Prices Index. Because the threshold is low and the term is long, most graduates pay for almost their whole working life without clearing the balance. The Institute for Fiscal Studies expects around four in five Plan 5 borrowers to repay in full, far more than under the old system.
Does having children mean I should stop saving for retirement?
Pausing pension contributions during the expensive childcare years is common, but it is the costliest pound to give up because it has the longest time to compound and often comes with employer matching and tax relief. The order most models favour is to protect the minimum that captures the full employer match and tax relief first, clear expensive debt second, and treat saving for a child's deposit as the goal you fund after your own retirement is on track. You can model the trade-off on your own numbers rather than guessing.
Glossary
- Cost of a Child report
- An annual study by the Child Poverty Action Group (CPAG), using the Minimum Income Standard researched at Loughborough University. It prices what a child needs for a minimum socially acceptable standard of living in the UK. The 2025 edition put the basic cost to age 18 at around £250,000 for a couple and £290,000 for a lone parent, including childcare but treating rent and council tax separately.
- Minimum Income Standard (MIS)
- A budget standard, researched by the Centre for Research in Social Policy at Loughborough University for the Joseph Rowntree Foundation, based on what members of the public agree households need for a minimum acceptable standard of living. It is the basis for the Cost of a Child figures, so those numbers are a floor for an adequate life, not an average of what families actually spend.
- Child Benefit
- A payment to anyone responsible for a child, worth £27.05 a week for the eldest child and £17.90 for each additional child in the 2026/27 tax year. It is not means-tested at the point of payment, but it is partly or fully reclaimed through the tax system once the higher earner's income passes £60,000 under the High Income Child Benefit Charge.
- High Income Child Benefit Charge (HICBC)
- A tax charge that recovers Child Benefit once the higher earner in a household has adjusted net income over £60,000, removing it entirely at £80,000. It is assessed on the highest individual income rather than household income, and it interacts with pension contributions, which reduce adjusted net income.
- Tax-Free Childcare
- A government top-up that adds £2 for every £8 a parent pays into a childcare account, up to £2,000 a year per child (£4,000 for a disabled child). Both parents must generally work and each earn under £100,000. It cannot be used at the same time as the childcare element of Universal Credit.
- Funded childcare hours
- Government-funded early-years hours in England. From September 2025, eligible working parents get 30 hours over 38 weeks a year, from when the child is nine months old until they start school. Each parent must earn at least the equivalent of 16 hours a week at minimum wage and under £100,000. Scotland, Wales and Northern Ireland run separate schemes.
- Junior ISA (JISA)
- A tax-free savings and investment account for a child, opened and managed by a parent or guardian but legally owned by the child, who gains access at 18. The annual allowance is £9,000, separate from an adult's £20,000 Individual Savings Account allowance. Growth, dividends and interest are tax-free.
- Plan 5 student loan
- The student loan repayment system for English students who started from the 2023/24 academic year. Repayments are 9% of income above a £25,000 threshold, the balance is written off 40 years after repayment begins, and interest is capped at the Retail Prices Index measure of inflation. The low threshold and long term mean most graduates repay for most of their working lives.
- Two-child limit
- A restriction, introduced in April 2017, that capped the child element of Universal Credit and Child Tax Credit at the first two children in a family. Following the Autumn Budget 2025 it is being removed from April 2026. At its peak it affected around 1.6 million children, each additional child losing up to £3,514 a year of support.
- Opportunity cost
- What money spent on one thing could have earned if used another way. A pound spent on nursery fees at age one also costs the larger sum that pound could have grown into over the years until it was needed elsewhere. It is the difference between the cash cost of children and their true cost to long-run wealth.
- Adjusted net income
- Total taxable income less certain reliefs, most importantly pension contributions and Gift Aid donations. It is the figure that decides the High Income Child Benefit Charge, the £100,000 childcare cliffs and the tapering of the personal allowance, which is why a pension contribution can restore benefits worth more than the contribution itself.
Sources
- Cost of a Child in 2025 — Child Poverty Action Group
- Child Benefit: what you'll get — GOV.UK
- High Income Child Benefit Charge — GOV.UK
- 30 hours free childcare if you're working — GOV.UK
- Tax-Free Childcare — GOV.UK
- Childcare Survey 2025 — Coram Family and Childcare
- Maternity pay and leave — GOV.UK
- Junior Individual Savings Accounts — GOV.UK
- Repaying your student loan: what you pay — GOV.UK
- Student loans in England, financial year 2024-25 — GOV.UK / Student Loans Company
- The impact of undergraduate degrees on lifetime earnings — Institute for Fiscal Studies
- Graduate labour market statistics 2024 — Department for Education
- Higher education tuition fees in England — House of Commons Library
- Applying VAT to private school fees — GOV.UK
- ISC Census and Annual Report 2025 — Independent Schools Council
- Families and households in the UK: 2024 — Office for National Statistics
- Removing the two-child limit on Universal Credit — GOV.UK
- Inheritance Tax on pensions: technical note — GOV.UK / HMRC
- Consumer price inflation, UK: May 2026 — Office for National Statistics
- Private rent and house prices, UK: December 2025 — Office for National Statistics
- Time Use and Labor Productivity: The Returns to Sleep — Gibson and Shrader, Review of Economics and Statistics (2018)
- Parents' sleep does not recover until six years after a first birth — University of Warwick, journal Sleep (2019)
- Why Sleep Matters: the economic costs of insufficient sleep — RAND Europe (2016)
- Global Investment Returns Yearbook 2026 (summary) — UBS