What Percentage of Your Salary to Save for Retirement: The UK Number Behind the Rules of Thumb
How much of your salary to save for retirement in the UK, why the rules of thumb cluster near 15%, and how to model your own rate instead of copying one.
A long-read planning briefing, roughly an hour
A Few Quid is not authorised or regulated by the FCA. This article is general information, not advice.
Ask how much of your pay to put toward retirement and a number comes back almost before you finish the question. Fifteen percent, says Dave Ramsey. Fifteen percent, says Fidelity. Half your age, says a good chunk of the British press. The figures are confident, and they mostly agree. They are also all borrowed from somewhere, usually from American research built on American returns and an American tax system. A percentage is a comforting thing to be handed. It is also the wrong unit to stop at. The right rate for you depends on when you started, when you want to stop, what you have already saved, and what you actually earn along the way. Two people on the same salary saving the same percentage can land decades apart.
This guide takes the percentage apart. It lines up the rules of thumb and the people behind them, and works out why they all drift toward the same teens. Then it digs into the assumptions doing the real work underneath, the return you can expect, the way risk shifts as you near the finish line, and the spending that drops once you stop. Behind all of it sits the slow retreat of the state from a job it once did for you. The guide also separates the two questions tangled up in that headline percentage, how much to save each year and how much to have saved by a given age, and asks what a high savings rate really buys you if you want to retire early. By the end you will be able to set a rate you can defend, and know which lever to pull when it slips.
A Few Quid is not authorised by the Financial Conduct Authority (FCA). This article is general information, not advice. Nothing here is a personal recommendation. For decisions about pension contributions, retirement timing, or how to invest, speak to a regulated financial adviser who can look at your whole situation.
How to read this guide
This is a long piece, so here is the shape of it before you start. It runs from the question, to the number, to the things that move the number.
We start with the two questions behind "how much should I save", because "what rate?" and "how much by now?" are different questions that people answer as if they were one. Then we set out what the rules of thumb tell you to save, from Dave Ramsey to the British "half your age" rule to what other countries make compulsory, and ask why they nearly all land in the teens.
From there we go after the reasons. Where the 12% to 15% figures come from rebuilds a savings rate from a target retirement income, so you can see what a rule of thumb stands in for. The investment return you can expect is the assumption that swamps all the others, and the one people get most wrong by confusing the headline figure with the after-inflation one.
The middle of the guide is about risk and time. How your investment risk should change near retirement explains why a young saver can hold mostly shares and a near-retiree usually should not, and covers the live argument about whether the textbook answer is right. Then we widen out. Why you now have to save more than past generations tracks the way risk has shifted from employers and the state onto you, and why you will spend less in retirement than you expect explains why your target is lower than a salary-replacement figure implies.
Then the harder questions. The risk of more tax on pensions looks at how often the rules around pensions move. Then retiring early (FIRE) in the UK shows what a high savings rate buys, and the very British obstacles in the way. Finally, two worked examples run one person through the machine, saving 15% and saving the 8% minimum, followed by how retiring at 55 instead of 67 changes the rate and how to work out your own number. Read it straight through if you have the hour. If not, the contents box will drop you where you need to be.
1. The two questions behind "how much should I save"
"How much should I save for retirement" is really two questions wearing one coat, and they have different answers. The first is a flow, the percentage of your income that goes in each year. The second is a stock, how much you need to have accumulated by a given age. Personal finance commentators move between the two without warning, which is why the advice can feel both everywhere and nowhere at once.
The flow question is the one most rules of thumb answer, because it is the one you can act on this month. You cannot directly choose to have three times your salary saved by 40, but you can choose to pay 12% of your wage into a pension starting tomorrow. The stock question is a checkpoint rather than a control. Fidelity's "one times your salary by 30, ten times by 67" milestones, which we will come to, are stock targets. They are useful for telling you whether you are ahead or behind, but useless as a dial you turn.
Both are proxies for the only number that actually matters, and neither is it. That number is the gap between the pot you are on track to have at your chosen retirement age and the pot your target income will require. A savings rate is just a guess at the flow that closes that gap, made before you know the gap. An age-based multiple is just a guess at the stock that closes it. When the underlying gap is visible, the percentage stops being a target handed down from a guru and becomes an output you can solve for.
Why the percentage is a shortcut, not the truth
A flat percentage assumes a lot of things hold steady that do not. It assumes your salary and your return run close to average, and that you have a full span of years to retirement, so a typical rate produces a typical result. Push any of those off centre and the same percentage builds a very different pot. Someone who starts at 22 and someone who starts at 40 can both save 12% and still retire in different decades. The early starter's first contributions get forty years of compounding. The late starter's get twenty-five.
A percentage that ignores what you already hold misleads in both directions, too. A 35-year-old with a healthy pot from an early start needs a lower rate from here than the rules suggest. A 35-year-old starting from nothing needs a much higher one. The headline figure cannot know which of you it is talking to. Your own numbers can.
What the rate is standing in for
The real version of the flow question is a chain. Decide your target retirement age and your target spending in today's money. Subtract what the state pension and any guaranteed income will cover. Turn the remaining income into a pot using a withdrawal rate. Compare that pot to what your current savings will grow into by your target age. The contribution that bridges the difference is your savings rate, and it falls out of the arithmetic rather than off a poster. The rest of this guide explains that chain link by link. By the end you can run it on yourself rather than borrow someone else's answer.
2. What the rules of thumb tell you to save
Put the popular answers side by side and the striking thing is how closely they agree. American advice, the British rules, and the rates other governments make compulsory all gather in roughly the same band. That agreement is worth understanding, because it is partly real and partly the same number copied between sources.
Start with the loudest voice. Dave Ramsey, the American host whose "Baby Steps" reach a large audience, says to invest 15% of gross household income for retirement. The 15% comes with conditions that often get dropped in the retelling. It is his fourth step, taken only after a starter emergency fund is built and all consumer debt is cleared, and it is meant to go into tax-advantaged accounts first. Fidelity, the fund manager, lands in exactly the same place. It advises savers to put away at least 15% of pre-tax income each year, explicitly including any employer match, from around age 25 to 67. Fidelity's number is not plucked from the air. It comes from a model that assumes you save continuously from 25, retire at 67, and want your savings alone to replace about 45% of your pre-retirement income, with the state doing the rest.
The UK has its own folk rule, and it is neater. The "half your age" rule says to take the age at which you start a pension and halve it. You then pay that percentage of your salary in for the rest of your working life, counting your employer's contribution. Start at 30 and it points to 15%, start at 40 and it points to 20%, start at 22 and it points to 11%. Legal and General phrase it almost identically, and Martin Lewis repeats it on MoneySavingExpert as a rough guide while stressing it is "not particularly accurate." It has no documented author. It belongs to the era of UK pension guidance that followed the Turner reforms rather than to any one person, and it is best treated as a memorable heuristic, not a calculation.
The "how much by now" milestones
The stock version of the question has its own set of numbers, and they come as salary multiples by age. Fidelity's are the most quoted. T. Rowe Price publishes a similar set as ranges, because the right multiple rises with income.
| Age | Fidelity (single multiple) | T. Rowe Price (range) |
|---|---|---|
| 30 | 1x salary saved | about 0.5x |
| 40 | 3x | 1.5x to 2.5x |
| 50 | 6x | 3.5x to 5.5x |
| 60 | 8x | 4.5x to 8x |
| 65 to 67 | 10x | 7.5x to 13x |
These milestones are the same model viewed from a different angle. Fidelity's "10x your salary by 67" is the pot that its 15%-from-25 saver ends up with, so the multiples and the rate are two faces of one assumption set. They are genuinely useful as a checkpoint, a quick way to tell whether you are ahead of or behind a steady path. They are misleading as a target, because they assume a US system with no flat-rate state pension. In the UK, the state pension does some of the work these multiples assume your pot has to do alone. So a British saver can often reach the same retirement on a smaller multiple than an American one.
What the rest of the world makes compulsory
The clearest evidence that the teens are not arbitrary is that several countries legislate something close. The UK's own auto-enrolment minimum is 8% of qualifying earnings. Australia goes much further. Its compulsory Superannuation Guarantee reached 12% of earnings on 1 July 2025 and stops there. Across the Organisation for Economic Co-operation and Development (OECD), the club of mostly richer economies, mandatory pension contributions for an average earner average 18.8% of the wage. Many of those schemes also fund disability or survivor benefits, so they are not pure retirement saving. The standout is the Netherlands, whose near-universal funded pensions deliver a net replacement rate of 96% of working income. That compares with an OECD average of 63% and a UK figure of just 54%, one of the lower numbers among rich countries.
The pattern is consistent. Wherever a system is designed to produce a comfortable retirement on its own, the mandated rate is well above the UK's 8% and clusters around the teens or higher. Where the mandate is low, as in the UK, the gap is meant to be filled by voluntary saving, which is exactly the gap every rule of thumb is trying to close.
One more figure sharpens it. The 15% that Fidelity advises is more than Americans actually manage. Vanguard's analysis of millions of US workplace-pension savers found the average worker putting in about 7.7% of pay themselves. That rises to around 12% once the employer match is counted, still short of the 15% target. The rule of thumb describes where people are told to aim, not where they land. Treating 15% as a comfortable floor rather than a stretch target is exactly the kind of optimism that leaves a plan short.
3. Where the 12% to 15% figures come from
A rule of thumb is a frozen calculation. Someone ran the sum once, rounded it, and handed out the answer so you would not have to. To know when 15% is right for you and when it is badly wrong, it helps to thaw the calculation back out and watch it run.
The sum starts from a retirement-income target, not a savings rate. The UK's benchmark for that target comes from the Pensions Commission, the body chaired by Adair Turner in the mid-2000s whose work still underpins official thinking. It set target replacement rates that fall as income rises. The logic is that lower earners must replace almost all of their income to keep their standard of living, while higher earners have more discretionary spending they can let go. The Department for Work and Pensions still uses these benchmarks.
| Pre-retirement earnings band | Target share of income to replace |
|---|---|
| Lowest earners | 80% |
| Lower-middle earners | 70% |
| Median earners | 67% |
| Upper-middle earners | 60% |
| Highest earners | 50% |
None of these reaches 100%, and that gap is the heart of the matter, with the chapter on retirement spending giving it the full treatment. In retirement you stop paying into a pension, you usually stop paying a mortgage, the commute ends, and your National Insurance falls away. A median earner aiming to replace about two-thirds of their income is aiming to keep their lifestyle, not two-thirds of it.
From a target income to a savings rate
Now the chain runs forward. Take a median earner aiming to replace roughly two-thirds of income. A good slice of that target is met by the state pension. The full new rate is £241.30 a week, about £12,548 a year in 2026/27, after a 4.8% rise under the triple lock. Whatever the state does not cover, the private pot must. To turn a pot into an income, you divide by a withdrawal rate of around 3.5%. The reasoning behind that figure sits in the chapter on retiring early, where the safe withdrawal rate gets its full airing. That gives the pot you need. Spreading the job of building that pot across a forty-year career, at a realistic after-inflation return, lands the required annual contribution somewhere in the low-to-mid teens as a share of pay. Change the inputs and the answer moves, which is the whole point.
The "half your age" rule, for all its lack of an author, is not silly. It encodes a real relationship. The later you start, the fewer years each contribution has to compound, so the higher the rate has to be to reach the same pot. Halving your starting age is a rough way of saying "buy back the lost compounding with a bigger slice of pay." It overshoots for some and undershoots for others, but the shape is right.
Where the rules break down
The rules break in two predictable places. The first is the qualifying-earnings trap. When people hear "the minimum is 8%" they picture 8% of their salary, but auto-enrolment is charged only on the band of pay between £6,240 and £50,270. On a salary of £45,000 the effective rate is closer to 7% of gross, and on higher salaries it is lower still as a share of the whole. The floor is even lower than it sounds.
The second is that the rules assume a steady forty-year run from a standing start at 25, with no career break, no late start, and no period of saving nothing. Real careers have gaps, and a rule calibrated for an unbroken run will leave a broken one short. Scottish Widows, in its 2026 Retirement Report, argues the 8% statutory minimum is too low and pushes for raising it toward 12%, with more like 15% needed for a comfortable retirement. That is the rules of thumb conceding that the legislated floor was set below the number their own arithmetic produces.
4. The investment return you can expect
Of all the inputs to a retirement plan, the assumed investment return does the most damage when it is wrong, because it compounds. A salary estimate that is off by a tenth is off by a tenth. A return that is off by a single percentage point, over a forty-year career, can change the final pot by a third or more. So it is worth being precise about what markets have actually delivered, and careful about the difference between the number on a fund factsheet and the number that matters.
The best long-run evidence is the UBS Global Investment Returns Yearbook, compiled by Dimson, Marsh and Staunton from 125 years of data across dozens of markets. Over 1900 to 2024, a global equity index returned about 5.2% a year after inflation. Government bonds returned around 1.7% real, and cash about 0.5%. UK equities specifically have returned roughly 5% a year after inflation, a figure the independent Barclays Equity Gilt Study, which runs from 1899, corroborates at just under 5%. Two separate datasets, built differently, agree on the UK number.
The phrase doing the work in all of those figures is "after inflation." A return quoted after inflation is a real return, and it is the one to plan with, because it keeps everything in today's money. The headline numbers a fund shows are nominal, before inflation, and they look much bigger. The 2026 Yearbook makes the gap concrete with the US market. US shares returned 9.8% a year in nominal terms over 125 years but only 6.6% after inflation, and the roughly three-point difference is exactly the 2.9% average annual inflation over that span.
| Asset (global, 1900 to 2024) | Real return (after inflation) | Rough nominal at 2% inflation |
|---|---|---|
| Equities (world index) | 5.2% a year | about 7.3% |
| Government bonds | 1.7% a year | about 3.7% |
| Cash | 0.5% a year | about 2.5% |
The practical rule that falls out of the table is simple. State your plan in today's money and feed it real returns. If you instead take a tempting nominal number like 7% or 8% and apply it to a pot you are thinking about in today's prices, you count inflation twice and flatter the result badly. The Bank of England targets 2% inflation, so a 5% real return is roughly 7% nominal and a 7% real return is roughly 9% nominal. Keep the two straight and the projection stays sound.
Why tomorrow may pay less than yesterday
There is a catch the long-run averages hide. The people who compiled the 125-year record expect the future to undershoot it. The same global equity index that returned 5.2% real over the full period returned only 3.5% real over the first quarter of this century. Dimson, Marsh and Staunton argue that today's high valuations make a smaller premium more likely from here. Vanguard's forward-looking model is more cautious still, projecting only about 2% to 3% real from US equities over the next decade because prices are stretched, while rating non-US shares more generously. History is the upper bound of what to assume, not the centre of it.
The fee that eats a quarter of your pot
One more drag belongs in any return assumption, because it is the part you control. Fees compound against you the way returns compound for you. The US regulator's worked example is stark. A $100,000 pot earning 4% a year for 20 years grows to about $208,000 with a 0.25% annual fee. With a 1% fee it grows to only about $179,000. That gap of $29,000, roughly 14% of the pot, comes from three-quarters of a percentage point. Stretch the horizon to a full career and a 1% yearly fee can remove close to a quarter of the final pot. A low-cost fund is not a minor housekeeping choice. It is one of the few return levers a saver can pull with certainty.
5. How your investment risk should change near retirement
For most of your saving life, the biggest risk is not that markets fall but that you held too little in the things that grow. A 30-year-old with decades ahead can watch a portfolio drop by a third and barely break stride. They are not selling anything, they have years to recover, and most of their real wealth is not in the pot at all. It sits in their future earnings, a steady, bond-like asset that turns up every payday. That is why a young saver can hold mostly shares. The rest of their balance sheet is already safe.
As retirement approaches, that logic inverts. Future earnings shrink toward zero, so the pot stops being a small part of your wealth and becomes most of it. And once you start drawing an income from it, a market fall is no longer a paper loss you can wait out. It is a forced sale at a bad price. This is sequence of returns risk, and it is the single most important idea in late-stage retirement planning. The order of returns barely matters while you are saving, because a 20% loss followed by a 25% gain leaves you where a 25% gain followed by a 20% loss would. It matters enormously once you are withdrawing. A crash in the first decade of retirement forces you to sell units to live on while prices are down. That permanently shrinks the capital base, so later gains have less to work on. The first ten years after you stop are the danger zone.
The glide path, and the default that runs it for you
The standard answer to rising risk is to lower it on a schedule, a process the pensions industry calls lifestyling or, more plainly, a glide path. A typical default fund holds a young saver in around 90% shares and automatically shifts the mix toward bonds and cash as the chosen retirement date nears, landing near 30% shares by the end. NEST (the National Employment Savings Trust), the UK's largest auto-enrolment scheme, runs its default members through a roughly five-year foundation phase, a thirty-year growth phase, and a consolidation phase. The final phase begins about ten years before retirement. Most people never choose this. They are defaulted into it and de-risked automatically, which for the majority is a feature rather than a bug.
The old rule of thumb behind all of this is "100 minus your age in equities", with 110 and 120 variants for the longer-lived. At 30 the rule of 100 puts you at 70% shares, at 70 it puts you at 30%. Like all such rules, it is a starting sketch. The modern criticism is that the original version de-risks too hard for a retirement that can now last thirty years, not the ten or fifteen it was designed around.
The argument the experts are still having
Here the textbook answer gets interesting. Wade Pfau and Michael Kitces published work in 2014 that turned the convention on its head. A retiree who does the opposite of conventional de-risking starts retirement conservative, at perhaps 30% shares, then drifts up toward 70% over thirty years. On their data, that retiree suffered fewer and smaller failures than someone holding a steady or declining allocation. Their mechanism is the bond tent. You hold the most bonds in the danger zone right around retirement. You spend them down to fund the early withdrawals, instead of selling shares at depressed prices. Then equity exposure climbs again once the high-risk window has passed. The retiree is least exposed to shares at the precise moment a crash would hurt most.
It is not settled. Karsten Jeske, who writes the Early Retirement Now safe-withdrawal series, tested it against real historical data rather than simulated returns. There, the rising path was one of the worse performers, and a simpler high-equity hold did better. He favours a faster glide instead. The disagreement is about method and shape, not substance. Everyone agrees the years on either side of your retirement date carry the most risk per pound. There is also a live UK wrinkle. Traditional lifestyling was built on the assumption you buy an annuity on the day you retire. Since the 2015 pension freedoms, most people stay invested and draw down for decades. So a default that has fully de-risked into bonds by the target date can leave a thirty-year drawdown under-exposed to the growth it still needs. If you intend to draw down rather than annuitise, the default glide may be more cautious than your real horizon warrants.
6. Why you now have to save more than past generations
Today's savings-rate advice asks more of you than your parents' generation ever heard. Two of the three pillars that used to hold up a retirement have been pulled out from under you. Understanding that shift is the difference between thinking the rules are scaremongering and seeing why they have to be.
The first pillar to go was the employer guarantee. A generation ago a large share of workers had a defined-benefit pension, a promise of a guaranteed income for life based on salary and service. The employer carried all the investment and longevity risk. That world has all but ended in the private sector. The Pension Protection Fund's 2025 Purple Book records just 4% of defined-benefit schemes still open to new members. The number of people actively building one has fallen to around 0.7 million, roughly a fifth of the figure twenty years ago. In its place is the defined-contribution pension, a pot you own and invest, where the risk that used to sit with your employer now sits with you. The savings rate matters more than it used to because there is no longer a promise behind it.
The diagnosis that this was leaving people short is not new. The original Pensions Commission under Adair Turner found in the mid-2000s that around 9 million people were under-saving, and framed the country's choice as four unpalatable options. Pensioners get poorer, taxes rise, people save more, or people work longer. Its answer was the system we now live in, automatic enrolment to make people save more, a simpler single-tier state pension, and a state pension age that climbs with longevity. Auto-enrolment, launched in 2012, got people started, bringing more than 11 million extra savers in with opt-out rates of only 8% to 10%. What it has not fixed is the amount. Twenty years on, a relaunched Pensions Commission reported in May 2026 that 15 million people are under-saving. It also found that 45% of working-age adults, around 18 million people, are putting nothing into a pension at all. The IFS reached a parallel conclusion in 2025. It found 39% of private-sector defined-contribution savers off track for an adequate income, and 13% not even on track for the minimum standard.
Why the state cannot keep its side as generously
The second pillar under pressure is the state pension itself, and the squeeze is demographic. Statisticians call the ratio of pensioners to working-age people the old-age dependency ratio. The Office for National Statistics (ONS) projects it to rise from 280 pensioners per 1,000 workers in 2024 to 329 by 2049. Within a decade the number of people of pensionable age grows from 12.4 million to over 14 million, and the over-85s roughly double by mid-century. Fewer workers are supporting more pensioners for longer.
That arithmetic shows up in the public finances. The Office for Budget Responsibility (OBR) reports that the state pension has grown from around 2% of national income in the mid-twentieth century to about 5% today, some £138 billion a year. It projects the figure to reach 7.7% by the early 2070s. The triple lock alone, which guarantees the pension rises by the highest of earnings, inflation or 2.5%, will have added an estimated £15.5 billion a year by 2029-30. That is about three times what was first expected, because the non-earnings parts of the lock kept being triggered. The state's main tool for containing this is the lever it is already pulling, raising the state pension age. Lifting it from 66 to 67, which is happening now and completes by 2028, cuts borrowing by an estimated £10.5 billion a year. A rise to 68 is legislated for the mid-2040s, with a review underway that could bring it forward. The direction of travel is clear. The state pension will arrive later, and lean more on what you saved yourself.
7. Why you will spend less in retirement than you expect
Most savings-rate advice leaves out a piece of good news, and its absence is why the big numbers can feel scarier than they need to be. You will almost certainly spend less in retirement than you do now, and less in late retirement than in early retirement. That is not a hope. It is one of the more consistent findings in the research, and it pulls the required pot, and therefore the required savings rate, down.
Start with why your target is below your current income before behaviour even changes. In retirement you stop saving into a pension, which is a large slice of pre-retirement outgoings that simply disappears. The mortgage is often paid off. The commute and its costs end. And you stop paying National Insurance entirely once you reach state pension age, a saving worth the main employee rate of 8% on earnings. None of that is belt-tightening. Those were the costs of being a worker and a saver, not of living, and they fall away once you stop. So the Pensions Commission's target replacement rates sit well below 100%. They range from about 80% of pre-retirement income for the lowest earners down to 50% for the highest, who have more discretionary spending to trim.
The shape of retirement spending
Then behaviour changes too, and in a recognisable pattern. The financial planner Michael Stein named the three phases the "go-go, slow-go and no-go years". They run from an active early stretch with the time and health for travel and projects, through a quieter middle as the big trips taper, to a late phase when activity falls away. The economist David Blanchett put numbers on it, coining the term the retirement spending smile. His US data showed real spending declining through most of retirement, by around 1% a year early on and closer to 2% through the middle years. Only late in life does it edge up, for health and care. The dip is real and substantial. Blanchett found many households need roughly 20% less in savings than a flat, never-falling spending assumption implies.
UK figures point the same way. The ONS Family Spending survey shows average weekly household spending falling steadily with the age of the household. It drops from about £688 a week for a household headed by a 50 to 64-year-old, to £547 for the 65 to 74 band, to £444 for the over-75s. Part of that fall is smaller households rather than thriftier ones, so it overstates the per-person drop, but the direction is unmistakable. People spend less as they age.
| Age of household reference person | Average weekly spend |
|---|---|
| 50 to 64 | about £688 |
| 65 to 74 | about £547 |
| 75 and over | about £444 |
The tail the smile hides
There is one genuine qualification, and it is the upturn at the end of the smile. Late-life care is expensive, and it is the cost the falling-spending story can lull people into ignoring. A self-funded residential care home in the UK now averages around £1,300 a week, roughly £67,000 a year, and nursing care more again. Most people will not need years of it, but some will, and it lands in exactly the no-go years when spending was supposed to be at its lowest. The sensible reading sits between two mistakes. Planning for an ever-rising budget oversaves. Assuming a smooth decline ignores the tail. Better to plan for a gently falling core budget with a separate contingency for care, so the average years and the unlucky tail are both covered.
8. The risk of more tax on pensions
A pension is the most tax-efficient way most people have to save for retirement, and nothing in this chapter changes that. But it comes with a risk that an ISA does not, and it is a risk worth pricing in rather than pretending away. A pension is a multi-decade promise wrapped in a tax regime, and the tax regime is set by governments who change it more often than the promise lasts. The money is locked up for thirty or forty years. The rules around it are not locked for anything like that long.
The clearest current example is already legislated. From 6 April 2027, most unused pension funds will count within your estate for inheritance tax, reversing a long-standing position in which pension pots sat outside the estate. For years the standard planning move was to spend other savings first and preserve the pension as a tax-efficient inheritance. That logic is being switched off. HMRC expects around 10,500 estates a year to face an inheritance tax bill they would have escaped, and 38,500 to pay more, with an average increase of about £34,000. Anyone whose plan leaned on passing a pension down untaxed has had the ground moved under them by a single Budget line.
It is not an isolated change. Look at the recent record and pensions are a recurring fiscal target.
- The lifetime allowance, a cap of £1,073,100 on tax-advantaged pension savings, was abolished in April 2024. In its place came a frozen tax-free lump sum allowance of £268,275, whose real value erodes every year it is not raised.
- From April 2029, the National Insurance break on salary-sacrifice pension contributions above £2,000 a year ends, a measure the OBR expects to raise about £4.7 billion a year.
- Pension tax relief costs the Treasury over £50 billion a year net, and the bulk of it goes to higher and additional-rate taxpayers. That keeps proposals to restrict higher-rate relief, or move to a flat rate, circulating at every Budget. None has been enacted, but the IFS estimates a basic-rate-only restriction would raise around £15 billion a year, a number large enough to keep the idea alive.
- The 25% tax-free lump sum itself draws regular speculation. The IFS has floated capping it at £100,000, the 2025 Budget left it untouched, but the mere rumour prompted a wave of savers to crystallise lump sums early.
None of this is new behaviour. In 1997 Gordon Brown abolished the dividend tax credit that pension funds could reclaim, a change widely called "the pensions raid" that cost schemes an estimated £5 billion a year. Pensions are a large, slow-moving pool of money that cannot easily flee or vote, which makes them a standing temptation for a Chancellor short of revenue.
What to do with that risk, without overreacting
The wrong response is to stop using pensions. The tax relief on the way in, often at your highest marginal rate, plus the employer contribution and tax-free growth, is too valuable to walk away from. For most people the pension remains the best-returning home for retirement money. The measured response is balance. An ISA is funded with taxed money but comes out completely tax-free and at any age, and it is far less entangled in the pension rule book. A plan split sensibly between a pension and an ISA stands up better to a rule change in either. It gives you tax-free income to draw alongside taxable pension income in retirement, and hands you accessible money for the years before a pension unlocks. Diversifying across tax wrappers is the same instinct as diversifying across assets, applied to political risk instead of market risk.
9. Retiring early (FIRE) in the UK
Everything so far assumes you want to stop work around the normal age. Turn the savings rate up high enough, though, and you can stop years or decades early. This is the territory of the FIRE movement, financial independence, retire early, and it recasts the savings rate from a background habit into the only number that matters.
The clearest statement of why is Mr Money Mustache's 2012 essay, The Shockingly Simple Math Behind Early Retirement. Its argument is that your time to financial independence depends almost entirely on the percentage of your take-home pay you save. That single figure sets both how fast your pot grows and how little you need it to cover. A higher savings rate is a double lever. It puts more in and it lowers the target at the same time. On his assumptions of a 5% real return and a 4% withdrawal rate, the relationship is dramatic.
| Savings rate (of take-home pay) | Years to financial independence |
|---|---|
| 10% | about 51 |
| 15% | about 43 |
| 25% | about 32 |
| 40% | about 22 |
| 50% | about 17 |
| 65% | about 10.5 |
| 75% | about 7 |
The jump from a 15% rate to a 50% one is not a third faster. It is more than twice as fast, turning a full career into seventeen years. That is the engine of the whole movement, and it is why FIRE is really a conversation about the savings rate dressed up as a conversation about retirement.
The British obstacles the US maths skips
The American maths needs two UK adjustments before you build a plan on it, and both make the path harder here.
The first is access. A UK private or workplace pension cannot normally be touched until the normal minimum pension age of 55, and that rises to 57 from 6 April 2028. For anyone aiming to stop in their forties or early fifties, the pension is locked for the years they most need money. The answer is an ISA, which can be drawn tax-free at any age, used as a bridge across the years between stopping work and the pension unlocking. Retire at 50 with pension access at 57 and you need roughly seven years of spending sitting in accessible ISAs before your pension can take over. The canonical UK FIRE structure pairs a self-invested personal pension (SIPP), which gets tax relief but is locked, with a stocks and shares ISA that funds the bridge. The Lifetime ISA is a tempting third leg but a trap for this purpose. Its money is locked until 60, and an early withdrawal triggers a 25% charge that claws back more than the bonus added.
The second adjustment is the withdrawal rate. The famous 4% rule, which produces the equally famous "save 25 times your annual spending" target, came from US market history. UK history is less kind. Monevator's analysis of UK data back to 1900 finds the equivalent safe withdrawal rate is nearer 3.1%, mainly because UK inflation has been worse and more volatile. That means a UK pot has to be about a third larger than the US rule implies for the same income. A 3.1% to 3.5% rate turns the 25-times target into something closer to 29 or 32 times. Early retirees, whose money must last forty or fifty years rather than thirty, lean toward the lower end still.
The flavours of stopping early
FIRE is not one destination. Lean FIRE means full early retirement on a deliberately frugal budget, a UK rule of thumb being under about £30,000 a year. Fat FIRE is the same freedom on a comfortable budget. Coast FIRE is the point where you have saved enough early that growth alone carries you to a normal retirement age, with no more added. From there you need only cover your current living costs. Barista FIRE is semi-retirement, where investments cover most spending and low-stress part-time work fills the rest. The common thread is that each is defined by a pot relative to spending, which is to say by the savings rate that built it.
10. Worked example: saving 15%
Rules stay abstract until a real person runs through them. So here is one, with every figure in today's money. The two worked examples that follow are the same person. She is 32, earns £45,000, and has £30,000 already saved across a workplace pension and a stocks and shares ISA. She wants to stop work at the state pension age of 67, which gives her a 35-year run. Between this example and the next, three dials move, her savings rate, the age she started, and the return she earns. The person never changes.
One rule governs how to read all the figures. Everything is in today's money. Inflation is assumed at 2%, in line with the Bank of England target, and stripped out of every return. So the central "5% real" return used here is roughly 7% in the nominal terms a fund factsheet shows. The more cautious 4% real is about 6% nominal, and the optimistic 6% real is about 8% nominal. Her target is the pot needed to fund a moderate retirement on top of the state pension. The Pensions and Lifetime Savings Association (PLSA) puts a moderate single retirement at £32,700 a year. The full new state pension covers £12,548 of that, leaving a gap of about £20,150 a year for her own pot to fund. At a UK-conservative 3.5% withdrawal rate, that gap needs a pot of about £576,000.
| Input | Value |
|---|---|
| Age now / target retirement age | 32 / 67 (a 35-year run) |
| Salary (today's money) | £45,000 |
| Already saved (pension plus ISA) | £30,000 |
| Real return assumed | 5% (about 7% nominal) |
| Target retirement lifestyle | PLSA moderate single, £32,700 a year |
| Pot needed for the gap above the state pension | about £576,000 |
At a savings rate of 15% of her salary, including her employer's contribution, she puts about £6,750 a year into the pot. Run forward at 5% real for 35 years, with her £30,000 head start compounding alongside, and the model in this guide's accompanying script lands her at about £775,000 in today's money. That clears the £576,000 target with around £200,000 to spare, a cushion that absorbs a worse-than-expected return or a few years of lower contributions. On these assumptions, 15% gets her comfortably there.
The cushion matters because the central case is not the worst case. A run of poor early returns, a career break, or a return closer to 4% than 5% would eat into that £200,000, which is exactly what it is for. A plan that only just reaches the target on the central assumption has no protection against the assumptions being wrong, and they usually are, in one direction or another.
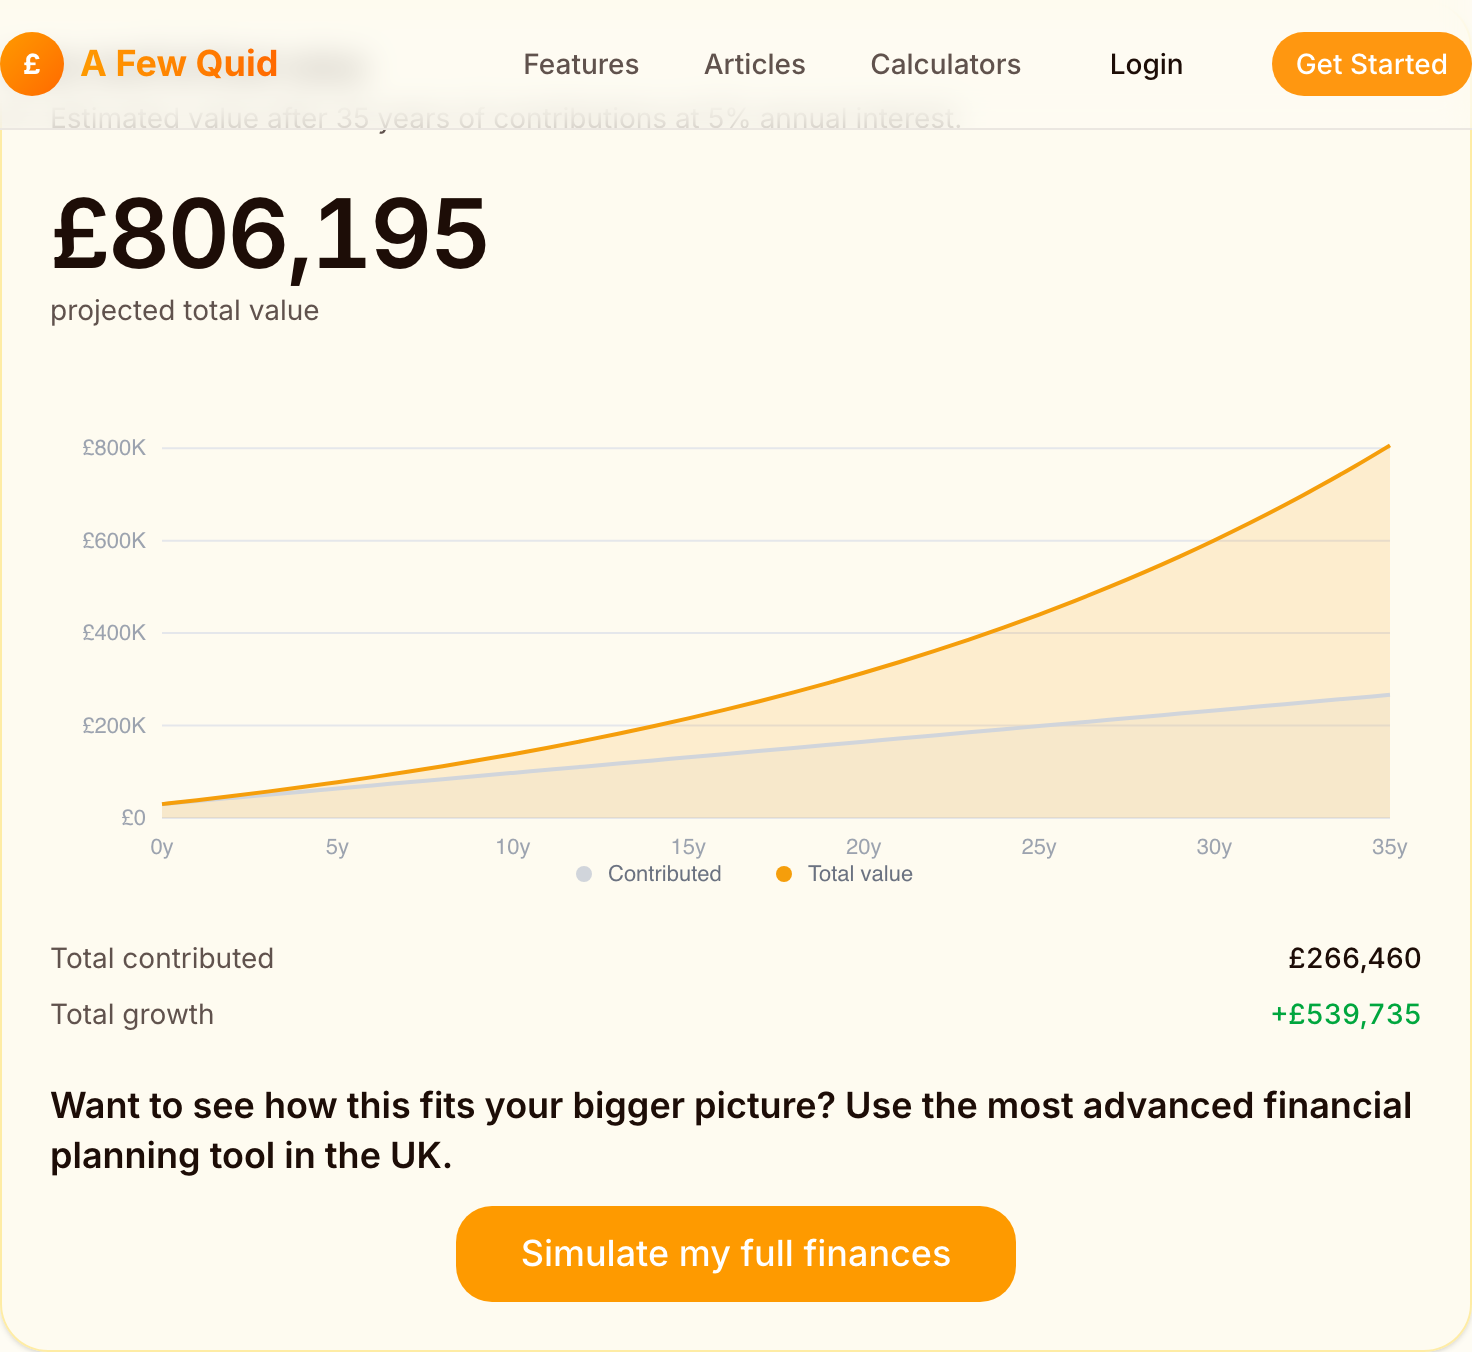
The chart above shows the same idea in the compound-interest calculator, with the 15% contribution paid in monthly rather than once a year. Paying monthly puts the money to work sooner, which lifts the result to about £806,000, and the picture makes the real lesson visible. The orange total pulls away from the grey contributions line, because over a long run the growth (about £540,000 here) outweighs everything she actually paid in (about £266,000). The pot is mostly compounding, not saving. So starting early and holding the rate steady does more work than any clever adjustment later.
11. Worked example: saving the 8% minimum
Same person. Same age, same salary, same £30,000 head start, same 35-year run to 67. Now drop her savings rate from 15% to the auto-enrolment minimum of 8% and watch the comfortable cushion turn into a shortfall.
At 8% of salary she puts in about £3,600 a year. Run forward on the same 5% real return for 35 years, the pot reaches about £491,000 in today's money, against the £576,000 her moderate retirement needs. She is short by around £85,000, roughly a seventh of the target. In income terms, her pot now funds a retirement somewhere between the PLSA minimum and moderate standards rather than the moderate one she was aiming for. Nothing went wrong. She simply saved the default, and the default was not enough.
It is actually worse than it looks, because of the qualifying-earnings trap from earlier. A real auto-enrolment 8% is charged only on the band from £6,240 to £50,270. So on her £45,000 salary the genuine contribution is about £3,100 a year, an effective rate under 7% of gross, not the £3,600 the clean 8%-of-salary figure assumes. The true auto-enrolment pot would fall a few thousand pounds short of even the £491,000 above. The rate that would have exactly closed her gap, on these assumptions, is about 10%. That tells you how fine the margins are, and why the rules of thumb reach for 12% to 15% to build in safety.
The grid: which dial actually moves the result
The two examples move one dial, the savings rate. The grid below moves all three, holding the same person fixed and pushing her start age and return to the edges of what is plausible, with the pot measured at 67 in today's money. Each row comes from the model in this guide's accompanying script.
| Savings rate | Started saving at | Real return | Pot at 67 | Against the £576,000 target |
|---|---|---|---|---|
| 8% | 25 | 4% | about £533,000 | short by £43,000 |
| 8% | 25 | 6% | about £980,000 | clear by £404,000 |
| 8% | 35 | 4% | about £331,000 | short by £245,000 |
| 8% | 35 | 6% | about £521,000 | short by £55,000 |
| 15% | 25 | 4% | about £863,000 | clear by £288,000 |
| 15% | 25 | 6% | about £1,534,000 | clear by £959,000 |
| 15% | 35 | 4% | about £528,000 | short by £47,000 |
| 15% | 35 | 6% | about £807,000 | clear by £231,000 |
Read the dials one at a time. The savings rate is the most reliable lever, because it is the one you control completely. At every pairing of start age and return, lifting the rate from 8% to 15% adds hundreds of thousands to the pot. The start age is nearly as powerful and runs only one way. Starting at 25 rather than 35 gives every contribution ten extra years to compound, which is why an 8% saver who began at 25 can out-finish a 15% saver who began at 35. The return is the wild card, the dial you influence through fees and asset mix but cannot set. At the extremes it swings the pot more than either of the others, turning the same 8%-from-25 saver from a near miss at 4% into a near-millionaire at 6%. The lesson is not that one dial wins. It is that the rate and the start date are the two you can actually move, so the practical advice is always the same. Start as early as you can and save more than the minimum, because those are the levers in your hand.
A realistic middle case, and where the model flatters
The grid maps the corners. Real life sits in the middle, so take one plausible central row. The same person saving 12% of salary, having started at 30, on a 5% real return.
| Savings rate | Started saving at | Real return | Pot at 67 | Against the target |
|---|---|---|---|---|
| 12% | 30 | 5% (7% nominal) | about £731,000 | clear by £155,000 |
A 12% rate, a touch above the half-your-age rule's reading for a 30-year-old, gets her there with room to spare. But this row carries a caution about the model worth naming rather than hiding, because it cuts both ways. The model holds her salary flat in real terms for 35 years, and most careers do not work like that. Real earnings tend to rise with promotions, so a flat-salary model understates the contributions a steady 12% actually produces. Re-run the same case with a modest 1% a year of real salary growth and the pot rises to about £808,000, roughly £77,000 higher, computed in the same script. Pulling the other way, expressing the target as the income gap divided by a withdrawal rate ignores the income tax due on pension drawdown. So the real gross pot she needs is somewhat larger than £576,000. The fair reading of the middle row is therefore a bracket, not a single figure. She is comfortably on track if her pay grows in real terms, as careers usually do, and closer to the line once drawdown tax is counted. Your own position depends on which of those forces is stronger for you.
12. How retiring at 55 instead of 67 changes the rate
Every figure so far measured the pot at the state pension age of 67. Change the finish line and the required savings rate changes more sharply than almost anything else, because moving your retirement earlier does three things at once, all of them expensive. It cuts the years your money compounds, it lengthens the years your money has to last, and it removes the state pension from the early stretch entirely.
Take the same 32-year-old and ask her to stop at 55 instead of 67. Her saving years fall from 35 to 23, so each contribution gets a decade less compounding. Her retirement stretches from perhaps 25 years to nearer 40, so the pot must sustain her far longer, which on its own argues for a lower withdrawal rate and therefore a bigger pot. And the state pension, worth £12,548 a year, does not arrive until 67, so for the first twelve years she funds the entire bill herself with no state contribution at all. The combination is why retiring at 55 can require not a slightly higher savings rate but a dramatically higher one, often double the rate that comfortably retires the same person at 67.
This is also where the simple model in the worked examples starts to creak, and it is worth being clear about what it leaves out at long range. A single average return hides sequence risk, which matters far more over a 40-year retirement than a 25-year one, because there are more bad early runs that can sink a long horizon. A flat withdrawal rate ignores the spending smile, which actually helps the early retiree, because real spending tends to fall through the middle years. And the model says nothing about the bridge problem covered earlier. Stopping at 55 under the current rules means even the pension is locked until 57, so the very first years must come from an ISA. The long-horizon view and the retire-at-67 view can give two different answers about how much to save. When they disagree, the longer horizon decides whether an early finish is real or wishful.
The practical upshot is that the savings rate and the target age are joined at the hip, and you cannot sensibly set one without the other. A 12% rate that retires you comfortably at 67 might leave you a decade short of stopping at 55. The reliable way to find your number is to fix the age you actually want, then solve for the rate, rather than picking a rate off a poster and hoping it lands you somewhere acceptable.
13. How to work out your own number
The first answer is the practical one. Put your real numbers into a thorough, UK-specialised financial calculator and work out your own rate, because every situation is different. The same person in this guide needed anywhere from 10% to well over 20%, depending only on when she started and when she wanted to stop. No article can know which of those is you. A good tool holds your salary, your existing pots, your retirement age and your target lifestyle. It also understands the state pension, the tax wrappers and the withdrawal-rate arithmetic. In an evening it settles what a headline percentage never will. Get started with A Few Quid.
If you would rather interrogate the decision yourself first, the rest of this guide reduces to a handful of questions. Answer them straight and most of the planning follows.
What age do you actually want to stop? Fix this before the rate, because it moves the rate more than anything else. The gap between stopping at 67 and at 55 can double the percentage you need, and you cannot solve for a rate without a finish line.
What does your target retirement cost, in today's money? Start from your real spending, not a salary multiple, then check it against the PLSA standards. Subtract what the state pension will cover, because the pot only has to fund the gap above it, and that gap is far smaller than the full figure.
What return are you assuming, and is it real or nominal? Plan in today's money on a real return of 4% to 5% for a mostly-equity pot, expect less than the long-run history, and keep your fees low. A single percentage point either way reshapes the whole result.
Are you capturing the full employer match, and saving more than the 8% default? The match is free money and the highest guaranteed return in any plan. The default is a floor, charged on only part of your pay, and every adequacy benchmark sits above it.
Have you kept some balance between the pension and the ISA? The pension wins on tax relief, but its rules change often and its money is locked for decades. So accessible, tax-free ISA savings hedge both the policy risk and the early years before a pension unlocks.
Then run it, on your numbers, stressed both ways. The what-if simulator prices a single change in minutes. The optimiser ranks how to split money between pension, ISA and debt. And the dashboard keeps the whole projection alive as your salary, your savings and the rules around them change, because this is not a decision you make once. The saver who revisits the number each year catches the pay rise that lets them lift the rate, the rule change that shifts the balance, and the moment an earlier finish becomes real rather than wishful.
About the author and this calculator
I am Mike Gallagher, based in the UK, and I built A Few Quid because the tools I could find for a question like this one handed out a percentage and called it advice. Save 15%, they said, with no idea how old I was, when I wanted to stop, what I had already saved, or what return I was assuming. The real answer to "what percentage should I save" is another question, "for what, by when, starting from where," and no rule of thumb can ask it. I wanted to see my own salary, my own pension and ISA, the actual UK state pension and tax rules, and a projection I could change one assumption at a time and watch respond.
A Few Quid is that tool. It runs UK-specific projections on your real inputs, models the what-if scenarios that a flat percentage cannot, and ranks how to split your money by projected outcome rather than telling you what to do. I am not a financial adviser, and A Few Quid is not authorised by the FCA, which I state plainly because it matters. The app is a calculator for exploring your own numbers, not a source of personal advice. For decisions with real consequences, a regulated adviser is worth their fee.
If you take one habit from this guide, make it this. Treat every savings-rate figure you meet, the famous 15% and the worked examples above alike, as someone else's inputs wearing a conclusion. The numbers here are accurate as of June 2026 and sourced below, but tax rules move and returns vary, and your life is not the worked example anyway. Build your own rate from your own parts. Fix it to the age you actually want to stop, and keep it current. That is the only version of the number worth having.
FAQ
What percentage of my salary should I save for retirement in the UK?
There is no single right number, but the rules of thumb cluster between 12% and 15% of gross pay including any employer contribution, and the UK 'half your age' rule lands in the same place for someone starting in their twenties or thirties. The figure rises the later you start and the earlier you want to stop. The reliable way to find yours is to model the gap between your projected pot and the pot your target retirement income needs, then solve for the contribution that closes it. A headline percentage is a starting point, not an answer for your situation.
Is the 8% auto-enrolment minimum enough to retire on?
For most people, no. The 8% minimum is charged only on qualifying earnings between £6,240 and £50,270, so on a £45,000 salary it works out at under 7% of gross pay. Every mainstream rule of thumb sits above it: Dave Ramsey's 15%, Fidelity's 15%, the UK half-your-age rule, and Scottish Widows' suggested 12% statutory floor. The Institute for Fiscal Studies (IFS) found that 39% of private-sector workers saving in a defined-contribution pension are not on track for an adequate income, and the low default is a big reason why.
What is the 'half your age' pension rule?
It is a UK rule of thumb that says to take the age at which you start a pension, halve it, and pay that percentage of your salary in for the rest of your working life, including your employer's contribution. Start at 30 and it points to 15%, start at 40 and it points to 20%. It has no single documented author and is repeated by Martin Lewis and many UK money sources as a rough starting point rather than a precise target. Its logic is that the later you begin, the harder each year has to work, so the rate has to climb.
Does Dave Ramsey's 15% rule work for a UK saver?
The 15% figure travels reasonably well, but the machinery underneath it does not. Ramsey's American framing assumes you clear consumer debt first and then route 15% of gross income into US tax accounts. A UK saver gets a state pension that covers a meaningful slice of retirement income, different tax wrappers (the ISA and the pension), and an employer contribution that counts toward the 15%. The headline percentage is a fine anchor. The accounts you put it in, and the state pension you build on top, are UK-specific.
How much should I have saved for retirement by 30, 40 or 50?
Fidelity's widely-cited age-based milestones suggest having roughly one times your salary saved by 30, three times by 40, six times by 50, eight times by 60 and ten times by 67. T. Rowe Price publishes similar figures as ranges that rise with income. They are useful sanity checks, not targets, and they assume a US system with no flat-rate state pension. In the UK the state pension does some of the work these multiples assume your pot has to do alone, so treat them as a rough gauge and model your own number.
What investment return should I assume on my retirement savings?
Over 1900 to 2024 world equities returned about 5.2% a year after inflation and UK equities around 5%, with government bonds nearer 1%, according to the UBS Global Investment Returns Yearbook. A real (after-inflation) return of 4% to 5% is a defensible planning assumption for a mostly-equity pot, falling as you de-risk toward retirement. Use real returns and state everything in today's money, because mixing a nominal return with today's prices double-counts inflation and flatters the result.
What savings rate do I need to retire early in the UK?
The early-retirement maths popularised by Mr Money Mustache shows the savings rate is the dominant lever. Saving half your take-home pay reaches financial independence in roughly 17 years on his assumptions, against more than 40 years at a 15% rate. The UK adds two twists. You cannot touch a private pension until 55 (57 from April 2028), so you need an Individual Savings Account (ISA) to bridge the years before then, and the UK safe withdrawal rate is nearer 3.1% to 3.5% than the American 4%, which means a larger pot for the same income.
Will the government tax my pension more in future?
It already plans to. From 6 April 2027 most unused pension funds fall within your estate for inheritance tax, reversing years of 'preserve the pension to pass it on' planning, and from April 2029 the National Insurance break on salary-sacrifice pension contributions above £2,000 a year ends. Pension tax relief costs the Treasury over £50 billion a year net, which keeps it a recurring target at fiscal events. None of this is a reason to stop saving into a pension, but it is a reason to keep some balance between the pension and the ISA and to revisit a plan built on today's rules.
Glossary
- Savings rate
- The share of your income you put toward retirement each year, usually quoted as a percentage of gross (pre-tax) pay and usually counting your employer's contribution alongside your own. It is the single biggest lever over how large a pot you build and how soon you can stop work.
- Replacement rate
- The percentage of your pre-retirement income that your retirement income replaces. The UK Pensions Commission set benchmark targets that fall as income rises, from about 80% for the lowest earners to 50% for the highest, because higher earners have more discretionary spending they can drop.
- Real return
- An investment return after inflation has been stripped out, so it measures growth in actual buying power. World equities have returned about 5.2% real a year since 1900. Retirement projections are clearest in real terms, because the figures then stay in today's money.
- Nominal return
- The headline return before inflation, the number a fund factsheet shows. At the Bank of England's 2% inflation target, a 5% real return is roughly 7% nominal. Feeding a nominal return into a plan stated in today's money double-counts inflation and overstates the result.
- Safe withdrawal rate
- The percentage of a pot you can withdraw in the first year of retirement, then raise with inflation, without running out over a set horizon. US research put it near 4%. UK-specific analysis puts the equivalent nearer 3.1% to 3.5%, because UK real returns have historically been lower and inflation more volatile.
- The 4% rule
- A planning shorthand from William Bengen's 1994 study and the 1998 Trinity Study, both using US market history, that a balanced portfolio could sustain an inflation-rising 4% withdrawal for 30 years. It is a US, 30-year, historical result, not a UK guarantee, and Bengen himself later raised his own figure to 4.7%.
- Auto-enrolment
- The UK policy, phased in from 2012, that automatically puts eligible employees into a workplace pension unless they opt out. The minimum total contribution is 8% of qualifying earnings, of which at least 3% comes from the employer.
- Qualifying earnings
- The band of pay on which auto-enrolment contributions are calculated, £6,240 to £50,270 in 2026/27. Because the band excludes the first slice of pay, an 8% contribution on qualifying earnings is a smaller percentage of your whole salary, a detail that understates how little the minimum really sets aside.
- Defined contribution pension
- A pension that is a pot of money you and your employer pay into and invest, where your retirement income depends on how much went in and how it grew. The saver carries the investment and longevity risk. This is now the dominant type of workplace pension in the UK.
- Defined benefit pension
- A workplace pension that promises a guaranteed income for life based on your salary and years of service, with the employer carrying the risk. Once common, it is now rare in the private sector, where only about 4% of schemes remain open to new members.
- Glide path (lifestyling)
- The practice of automatically shifting a pension from higher-risk assets like shares toward lower-risk assets like bonds as the saver nears retirement. A typical default fund holds around 90% shares for a young saver and glides toward roughly 30% by the retirement date.
- Sequence of returns risk
- The danger that the order of investment returns, not just their average, drives your outcome once you are drawing an income. A market crash in the first years of retirement forces you to sell assets while prices are down, permanently shrinking the pot in a way the same crash a decade later would not.
- FIRE
- Financial independence, retire early. A movement built on saving a high share of income to reach a pot large enough to live on decades before normal retirement age. In the UK it requires an ISA to bridge the years before a pension can be accessed at 55 (57 from April 2028).
- SIPP (self-invested personal pension)
- A personal pension you control yourself, holding a wide range of investments, with the standard pension tax treatment: relief on the way in, tax-free growth, 25% tax-free at retirement, and the rest taxed as income on the way out. It cannot be accessed before the normal minimum pension age.
- ISA (Individual Savings Account)
- A UK tax wrapper where growth and withdrawals are tax-free, with a £20,000 annual allowance. A stocks and shares ISA invests in markets and, because it can be drawn at any age with no tax, is the natural tool for funding early-retirement years before a pension unlocks.
- State pension
- The UK government pension paid from state pension age, currently 66 and rising to 67 by 2028 and 68 in the mid-2040s. The full new state pension is £241.30 a week, about £12,548 a year in 2026/27, and needs 35 qualifying years of National Insurance to reach in full.
- Triple lock
- The policy that raises the state pension each year by the highest of Consumer Prices Index (CPI) inflation, average earnings growth, or 2.5%. It protected the pension with a 4.8% rise in April 2026, and the Office for Budget Responsibility (OBR) treats its long-run cost as a fiscal risk.
- Pension annual allowance
- The most you can pay into pensions each year while still getting tax relief, £60,000 or 100% of earnings if lower in 2026/27. It tapers down to a £10,000 floor for the highest earners and drops to £10,000 once you flexibly access a defined-contribution pension.
- The retirement spending smile
- David Blanchett's finding that real spending in retirement tends to fall through the active and middle years before rising late in life for health and care, tracing a shallow U. It means many households need less than constant-spending models assume, though the late-life care tail is real.
Sources
- The new State Pension: what you'll get — GOV.UK
- State Pension age timetable — GOV.UK
- Workplace pensions: what you, your employer and the government pay — GOV.UK
- Individual Savings Accounts (ISAs) — GOV.UK
- Lifetime ISA — GOV.UK
- Tax on your private pension contributions: annual allowance — GOV.UK
- Increasing the Normal Minimum Pension Age — GOV.UK
- Inheritance Tax on unused pension funds and death benefits (from April 2027) — GOV.UK
- Changes to salary sacrifice for pensions from April 2029 — GOV.UK
- Income Tax: maintaining the Personal Allowance and basic rate limit until 5 April 2031 — GOV.UK
- Retirement Living Standards (2026 figures) — PLSA / Pensions UK
- Analysis of Future Pension Incomes 2025 (Turner replacement-rate benchmarks) — GOV.UK (DWP)
- The Pensions Review: final recommendations — Institute for Fiscal Studies
- Britain is undersaving for retirement, warns Pensions Commission — GOV.UK (DWP)
- The Purple Book 2025 (defined-benefit universe) — Pension Protection Fund
- National population projections: 2024-based — Office for National Statistics
- Fiscal risks and sustainability, July 2025 — Office for Budget Responsibility
- Family spending in the UK: April 2024 to March 2025 — Office for National Statistics
- Global Investment Returns Yearbook 2026 (public summary) — UBS
- The retirement spending smile — Kitces.com (on David Blanchett's research)
- The Shockingly Simple Math Behind Early Retirement — Mr Money Mustache
- What is the UK safe withdrawal rate? — Monevator
- How much money should I save each year for retirement? — Fidelity Viewpoints
- Pensions at a Glance 2025 — OECD