How Much Do You Need to Retire in the UK: The Deep Dive
Pension pot sizes, PLSA benchmarks, withdrawal rates and the state pension, worked through. The UK-specific way to model your own retirement number.
A long-read planning briefing, roughly an hour
A Few Quid is not authorised or regulated by the FCA. This article is general information, not advice.
Ask ten people how much you need to retire and you will get ten round numbers. A million pounds. Half a million. "Twenty-five times your salary." Most of these answers are imported from American research, built on American market returns and an American tax system, then dropped into a UK conversation where almost none of the assumptions hold. They are not wrong, just borrowed. And a borrowed number is a poor thing to stake a decade of your life on.
This guide goes slower. Instead of a figure, it hands you the method for building your own, anchored in UK rules. The Pensions and Lifetime Savings Association (PLSA) living standards that price out real British retirements. The state pension arithmetic that changes everything. The withdrawal-rate question, and where the famous 4% rule actually came from. The tax wrappers your money sits in, and the order you empty them. By the end you will be able to look at your own spending, your own pension, and your own timeline, and produce a target you can defend.
A Few Quid is not authorised by the Financial Conduct Authority (FCA). This article is general information, not advice. Nothing here is a personal recommendation. For decisions about pension contributions, retirement timing, or drawdown strategy, speak to a regulated financial adviser who can look at your full situation.
How to read this guide
This is a long piece, so here is the shape of it before you commit. Think of it as a path from the softest input to the hardest output.
We start with spending, because every credible retirement number is a spending number in disguise. Salary multiples and income-replacement percentages skip this step, and that is exactly why they mislead.
From there we move to the PLSA Retirement Living Standards, the closest thing the UK has to an agreed price list for a minimum, a moderate, and a comfortable retirement. These give your spending estimate a sanity check against what real households actually pay.
Then comes the state pension, the single biggest reason a UK number differs from an American one. For most people it covers a meaningful slice of the bill, it arrives on a fixed schedule, and it shapes the tax you pay on every other pound of income.
The middle of the guide is the withdrawal rate: how you turn a pot into an income. This is where the 4% rule lives, and it is worth understanding where that rule came from, why a careful UK figure is lower, and why two respected sources can quote 3.1% and 4.7% in the same year without either being wrong. Around it sit the annuity-versus-drawdown choice and the tax mechanics that decide how much of your withdrawal you actually keep.
After that we get practical. The three buckets your money sits in, the order you empty them, the bridge you need if you stop work before state pension age, how much to save now to get there, and the handful of variables, housing chief among them, that move the target by six figures.
Finally there are two worked examples that run realistic people through the whole machine, and a short note on who built this and why. Read it start to finish if you have the hour. If you do not, the contents box above will drop you wherever you need to be.
1. Start with spending, not a salary multiple
Almost every retirement calculator opens with the wrong question. It asks what percentage of your salary you want to replace, then assumes a US-style answer of 70 to 80% without telling you. That rule of thumb exists because, in retirement, commuting stops, the mortgage is often gone, and you are no longer setting money aside for retirement itself. The logic is real. It translates badly to a UK household.
Look at what your pre-retirement income actually contains. A chunk of it is income tax. Another chunk is National Insurance, which you stop paying once you reach state pension age. A further slice is the pension contribution coming straight off your payslip. None of that is spending. So when a tool tells you to replace 75% of a £50,000 salary, it is telling you to fund things you will not be buying.
Housing makes the income-replacement approach worse. Two people on identical salaries can have completely different retirements depending on whether they own outright, are five years into a mortgage, or rent. The salary number knows nothing about which of those is true for you. Spending knows everything.
What your spending will actually do
If you are a decade or more out, your spending is a moving target, and it tends to move in a recognisable pattern. Researchers call it the retirement spending smile. Early retirement is expensive, because you finally have time to travel, eat out, and take on the projects work crowded out. The middle years dip as you settle into quieter routines and the big trips taper off. Later years can rise again, sometimes sharply, as health and care costs appear.
A single flat number across thirty years hides all of that. Better to sketch three rough phases: an active early phase, a slower middle, and a later phase with a care contingency sitting beside it. You do not need precision. You need to stop pretending your spending is a straight line, because planning a straight line is how people end up short in the years they most wanted the money.
The starting point that works
The one reliable way to anchor the whole exercise is to look at what you spend now. Not a guess, not a budget you wrote on a good day, but the actual outflow from your bank statements over a few representative months. Strip out the things that vanish at retirement, the commuting, the childcare, the pension contributions. Add the things that grow, the travel, the hobbies, the healthcare. What remains is your real retirement spending in today's money, and it is the foundation every later number is built on.
2. The UK yardstick: PLSA Retirement Living Standards
Once you have a spending estimate, you want something to check it against. In the UK the obvious reference is the PLSA Retirement Living Standards, produced by the Pensions and Lifetime Savings Association and researched by Loughborough University. They are the nearest thing this country has to an agreed answer on what different retirements cost, and they are rebuilt regularly from actual UK household spending and public focus groups. The figures below are the current 2026 set.
The standards describe three lifestyles, and they assume you own your home outright. That last detail matters enormously, and we will come back to it.
Minimum, £13,900 a year for a single person. This covers your needs with a little left over for fun. Food, utilities, transport, a UK holiday, the odd meal out. It is not bleak, but it leaves no room for surprises and very little for travel.
Moderate, £32,700 a year. This is the standard most people picture when they imagine a decent retirement. An annual holiday abroad, a reasonably new car replaced every ten years or so, eating out a couple of times a month, and enough slack to absorb a bad week without anxiety.
Comfortable, £45,400 a year. More foreign travel, a better car, more spontaneity, and the means to help family financially. Not lavish, but unworried.
Couples need more than a single person but considerably less than two singles, because so much of a household's cost is shared. For a two-person household the minimum is £22,500, moderate is £45,400, and comfortable is £62,700. Notice that a couple aiming for moderate is targeting the same total as a single person aiming for comfortable. Two people are cheaper to run than one.
Reading the standards correctly
Two cautions, because both trip people up.
First, these are spending figures, not income figures. If your retirement income is taxed, and pension drawdown is, the gross amount you withdraw to reach £32,700 of spending is higher than £32,700. We deal with that gap in the withdrawal-rate and tax sections, but hold the distinction now.
Second, they exclude housing costs. The numbers assume the mortgage is gone and you are not renting. If you expect to still be paying for housing in retirement, add that cost on top before anything else, because it is often the largest single line in the budget and the standards deliberately leave it out.
The PLSA figures are best used as goalposts, not as your target. Most households land somewhere between moderate and comfortable. Your own spending estimate from the previous section is the real target. The standards just tell you whether that estimate is in a sane range or whether you have forgotten something expensive.
3. What the state pension really gives you
Here is where a UK retirement plan stops resembling an American one. The state pension is a substantial, inflation-protected, guaranteed income that arrives on a known date, and it does more to shrink the pot you need than almost any other single factor.
The full new state pension
The full new state pension is £241.30 a week in 2026/27, about £12,548 a year. That figure followed a 4.8% triple-lock rise in April 2026, as GOV.UK confirmed. To get the full amount you need 35 qualifying years of National Insurance (NI) contributions, as set out on the GOV.UK new state pension page. Fewer years means a proportionally smaller pension, and you need at least 10 qualifying years to receive anything at all.
The headline figure is not what most people will get, which is why checking your own forecast is the most valuable ten minutes in this whole exercise. Career breaks, part-time years, periods of self-employment without voluntary contributions, and time spent abroad all leave gaps. Many people find their forecast several thousand pounds a year below the full rate.
Gaps, voluntary contributions, and deferral
A shortfall on your NI record is often fixable, and the maths can be remarkable. Buying back a missing year through voluntary Class 3 contributions costs in the low hundreds of pounds for that year, and it can add roughly £330 a year to your state pension for life. Someone who lives twenty years past state pension age turns a few hundred pounds into several thousand. MoneyHelper, the government-backed guidance service, explains how to read the forecast and weigh up filling a gap. There are deadlines on how far back you can go, so this is a "check it now" job rather than a "deal with it later" one.
Deferral works the other way. If you do not need the state pension the moment it becomes available, putting it off increases it by just under 5.8% for each full year deferred. Whether that beats taking it and investing the money depends on your circumstances and your health, but it is a lever worth knowing exists.
The state pension age itself is currently 66, rising to 67 between 2026 and 2028, with a further rise to 68 legislated for the mid-2040s that affects anyone now in their forties or younger. The exact date matters for early-retirement planning, because the longer the state pension sits beyond your stopping date, the longer the bridge you fund yourself.
How it reshapes the pot
The state pension changes the maths in a way worth seeing plainly. You only need private savings to cover the gap above it. At the PLSA moderate level of £32,700, a single retiree drawing the full state pension needs their own savings to produce around £20,150 a year. At the comfortable level of £45,400, the gap is around £32,850. Those gaps, not the full spending figures, are what your pot has to fund.
That single adjustment is why a sensible UK number is so often far below the million-pound folk wisdom. A large, guaranteed, index-linked income is doing a lot of the heavy lifting before your pot is asked to do anything.
The personal allowance trap
The state pension also interacts with income tax in a way that catches people out. The personal allowance is £12,570 for 2025/26 and frozen. The full new state pension at £12,548 sits just beneath it. So the state pension uses up almost the entire tax-free band on its own. Any pension drawdown you take on top is therefore taxed from close to the first pound, at 20% for a basic-rate taxpayer and 40% for a higher-rate one. ISA withdrawals, by contrast, are invisible to income tax and do not touch the personal allowance at all.
4. From a pot to an income: the withdrawal rate
You have a spending target and you know what the state pension covers. The remaining question is the hinge of the whole plan: how much can you safely pull out of an invested pot each year without running out? Get this wrong on the high side and you run dry in your eighties. Get it wrong on the low side and you die with a fortune you denied yourself. The number that answers it is the safe withdrawal rate, and it has a surprisingly specific history.
Where the 4% rule came from
In October 1994, a Californian financial planner named William Bengen published a paper in the Journal of Financial Planning called Determining Withdrawal Rates Using Historical Data. He asked a question nobody had answered cleanly. If a retiree had retired in any year of US history, how much could they have withdrawn each year, rising with inflation, and still had money left after 30 years?
Using actual US market returns back to 1926 and a portfolio of 50% US shares and 50% intermediate US government bonds, Bengen found that 4% of the starting pot was the number that held. A retiree taking 4% in year one, then raising that pound amount by inflation every year after, would have survived every historical 30-year window he tested, including the brutal start dates of the late 1960s. He called the worst-case sustainable rate the SAFEMAX. The press called it the 4% rule, and it stuck.
Four years later, three finance professors at Trinity University in Texas, Cooley, Hubbard and Walz, published the study that cemented it. Their 1998 paper, Choosing a Withdrawal Rate That Is Sustainable, now universally called the Trinity Study, tested a grid of withdrawal rates and stock-bond mixes against US data from 1926 to 1995 and reported the probability that each combination survived. A roughly 4% inflation-adjusted withdrawal from a share-heavy portfolio came out with very high success over 30 years. Two separate teams, same headline figure. The rule of thumb stuck.
Why your UK number is lower
Now the uncomfortable part. That 4% was measured on American market history, and the United States had an unusually good century. Run the same exercise on UK data and the safe figure falls.
The most thorough UK analysis is on the Monevator blog, which used British return data stretching back to 1870. Its conclusion was that the UK equivalent of the 4% rule is closer to 3.1% for a 30-year retirement on a high-equity portfolio. The main culprit is inflation. A safe withdrawal rate depends on real returns, returns after inflation, and the UK's inflation record has been worse and more volatile than America's. The UK's worst-case retirement start years, 1910 and 1937, were grim enough that a 4% withdrawal would have emptied the pot in well under two decades. To draw 4% as safely as a US retiree could, a UK retiree historically needed a pot about a third larger.
This is not a reason to despair. It is a reason to use a UK figure. A planning rate somewhere between 3.1% and 3.5% is a defensible UK starting point, leaning toward the lower end if you are retiring young and need the money to last 40 years rather than 30.
Why the same year can give you 3.1% and 4.7%
Read around this topic and you will find respected sources quoting very different rates. The disagreement is about method, not competence.
Morningstar publishes an annual safe-spending estimate built on forward-looking return forecasts rather than pure history. Because bond yields and share valuations move, its number moves too. It was 3.3% in 2021, rose to 4.0% by 2023 as expected returns recovered, then settled back to 3.7% in 2024 and 3.9% in 2025. Meanwhile Bengen himself never stopped working on the original problem. Adding more asset classes and more data, he revised his own figure upward, first to 4.5% in 2006 and then, in a 2025 book, to a worst-case 4.7%, arguing that under normal conditions a retiree could reasonably take 5% or more.
So you have three defensible answers in the same era. Forward-looking US models around 3.7 to 3.9%. The rule's own author at 4.7% on long US history. UK historical data near 3.1%. They are different lenses on the same question, not contradictions. The lesson for a UK planner is to pick a conservative figure, hold it steady, and not raise your spending every time a new headline rate appears. As Morningstar itself stresses, lurching your withdrawals to chase each year's number defeats the entire purpose of having a rule.
Turning the rate into a pot target
With a rate chosen, the pot target falls out of simple division. Take the income gap your pot must cover, the spending figure minus the state pension, and divide by your withdrawal rate.
At a cautious 3.5%, the PLSA moderate gap of around £20,150 divided by 0.035 gives a pot of roughly £576,000. The comfortable gap of around £32,850 divided by 0.035 gives roughly £939,000. Drop the rate to a more conservative 3.1% and both numbers climb by about 13%. Raise it to 4% and they fall. The pot target moves a lot for a small change in the rate. That is why the rate gets a section to itself.
One more wrinkle. These are pre-tax figures on the pension side. If the income comes from an ISA it is tax-free, so the gross withdrawal equals the spending. If it comes from a pension it is taxed, so you need a larger gross withdrawal, and a larger pot, to land the same amount in your pocket. The split between your pension and your ISA changes the headline pot. That split is the next few sections.
5. Annuity or drawdown: the other big lever
The withdrawal rate assumes you keep the pot invested and draw from it, which is called drawdown. That is one of two ways to turn a pension into income, and the choice between them changes how much certainty you have and how much risk you carry. For years the annuity was treated as old-fashioned. Rising interest rates have put it back on the table.
What an annuity buys you
An annuity is a deal with an insurer. You hand over some or all of your pot, and in return they pay you a guaranteed income for the rest of your life, however long that turns out to be. The attraction is certainty. You cannot run out, and a market crash the year after you buy does not touch your income. The insurer has taken on both the longevity risk and the sequence risk that would otherwise sit on your shoulders.
The cost is flexibility and legacy. Once bought, a standard annuity is usually irreversible, the income may not keep pace with inflation unless you pay extra for an inflation-linked version, and when you die the pot is gone rather than passing to your family. Annuity rates also move with interest rates, so the income £100,000 buys today is very different from what it bought in the low-rate years around 2021.
What drawdown buys you
Drawdown keeps the pot invested in your name. You take what you need, the rest stays in the market, and anything left when you die can pass to your estate. The upside is growth and the freedom to change course. The downside is that every risk the annuity removed now sits with you. A bad run of early returns, an unexpectedly long life, or a stretch of high inflation are all yours to manage. The whole safe-withdrawal-rate question exists because drawdown leaves these risks with you.
The middle path most people actually want
The choice is rarely all of one or none of the other. A common UK approach is to use guaranteed income to cover the essentials, the spending you must meet whatever the markets do, and to use drawdown for the discretionary part on top. If you already have a defined benefit pension or a full state pension, much of that essential floor may already be guaranteed, which frees the rest of your pot to stay invested. Some people also annuitise gradually, buying guaranteed income in stages through their sixties and seventies as annuity rates tend to improve with age.
There is no single answer. The mix turns on your health, the guaranteed income you already have, and how much uncertainty you can stomach, so it is one of the few decisions where paying a regulated adviser tends to pay off.
6. The three buckets: pension, ISA, and the rest
Your retirement money lives in tax wrappers, and the wrapper decides how the money is taxed going in, while it grows, and coming out. Three of them carry almost all UK retirement saving, and understanding the trade-offs between them is what separates a plan from a pile of accounts.
Private pension
A private pension, the umbrella term for both your workplace auto-enrolment scheme and any personal pension such as a self-invested personal pension (SIPP), grows free of income tax and capital gains tax inside the wrapper. Contributions attract tax relief at your marginal rate, so a basic-rate taxpayer gets 20% relief and a higher-rate taxpayer gets 40%. That relief is the pension's biggest edge. A higher-rate taxpayer turns 60p of take-home pay into £1 working inside the pension.
From age 55, rising to 57 in 2028, you can access it. Up to 25% comes out tax-free, capped at £268,275 across all your pensions, and the rest is taxed as income when you draw it. The annual allowance, the most you can pay in each year with tax relief, is £60,000 or 100% of your earnings if lower. High earners with adjusted income over £260,000 face a taper down to a £10,000 floor. This is a contribution cap, not a growth cap. A pot can grow far beyond £60,000 in value with no charge.
If your employer matches contributions above the auto-enrolment minimum, capturing that full match is the highest-return move available anywhere in a financial plan. It is free money with an instant, guaranteed return that no investment can promise.
Stocks and shares ISA
An ISA grows tax-free and, just as important, pays out tax-free. Withdrawals count as neither income nor capital gains, and the annual allowance is £20,000. For long-term wealth the relevant flavour is the stocks and shares ISA, which invests in markets, rather than the cash ISA, which is sensible for short-term money but loses real value to inflation across a long horizon.
The ISA's retirement value is precisely that its withdrawals do not touch income tax. That makes it the natural partner to a pension. Drawing from the ISA in the early years keeps your taxable income low, preserves your personal allowance, and lets the pension keep growing tax-deferred for longer. We use exactly that move in the worked examples.
General investment account and the rest
Beyond the wrappers sits the general investment account (GIA), plain holdings with no shelter. Gains above the annual capital gains tax allowance, £3,000 in 2025/26, are taxable, and dividends above the £500 dividend allowance are taxed too. A GIA earns its place only once you have used your ISA and pension allowances for the year. In retirement it is usually the first pot you draw down, because it is the least tax-efficient to hold.
Two honourable mentions. The Lifetime ISA adds a 25% government bonus on up to £4,000 a year for under-40s saving toward a first home or retirement, with a penalty for withdrawals outside those uses. And defined benefit pensions, the increasingly rare schemes that pay a guaranteed income based on your salary and service, change the calculation completely if you have one, because they behave more like a second state pension than a pot.
7. Tax in retirement: the part people underestimate
People plan their pot in gross terms and spend in net terms, and the gap between the two is tax. A retirement plan that ignores how withdrawals are taxed will always overstate how far the pot goes. Most plans forget to subtract it, then wonder why the pot runs short.
How pension drawdown is taxed when you first take it
The first surprise is mechanical. The first time you take taxable income from a pension, the provider usually applies an emergency tax code on a month-one basis. That code assumes the single payment you just took will repeat every month for the rest of the year, so it taxes you as if your annual income were twelve times larger than it is. On a large first withdrawal, the over-deduction can run into thousands of pounds.
You get it back. HMRC either corrects it automatically at the end of the tax year or sooner if you submit the relevant reclaim form. It is not a permanent loss, but the cash-flow delay catches people out, so plan a first large withdrawal around the money you will actually receive that month, not the headline amount.
The allowances that still help you
Even with the personal allowance largely consumed by the state pension, a few allowances remain useful in retirement. The personal savings allowance lets a basic-rate taxpayer earn £1,000 of interest tax-free, a higher-rate taxpayer £500. The dividend allowance shelters the first £500 of dividends. The capital gains tax allowance, £3,000, applies to gains in a general investment account. None of these is large on its own, but together they let you draw a slice of income each year from outside your pension at little or no tax, which is the whole logic of holding more than one type of account.
Stacking your income in the right order
Because different income is taxed differently, the order you stack it within a single year matters as much as the order you empty accounts across years. A common approach is to take taxable income up to the point where it would cross into a higher tax band, then top up the rest of your spending from tax-free sources, the ISA and the 25% pension lump sum, so that none of your income is taxed at 40% if you can avoid it. Repeated each year, this keeps more of the pot out of the 40% band than just drawing whatever is to hand.
8. Drawdown order: which pot to empty first
Two people with identical pots can pay very different lifetime tax bills depending purely on the order they draw their accounts down. This is one of the few places in personal finance where sequencing alone, with no extra saving and no better returns, can be worth a five-figure sum.
The conventional UK sequence
The common UK approach runs roughly like this. Spend the GIA first, because it is the least tax-efficient to hold and gains are taxed as you go. Then lean on the ISA through the early retirement years before the state pension starts, because ISA withdrawals are tax-free and keep your taxable income low. Then bring in the pension, taking the 25% tax-free element strategically and managing the taxable drawdown to stay inside lower tax bands where you can. The state pension arrives last and runs for life, picking up a guaranteed slice of the bill.
The thread through all of this is to keep taxable income low for as long as possible while letting the most tax-advantaged pot, the pension, compound untouched.
The April 2027 change that rewrites the old advice
For years there was a second reason to preserve the pension for last: it sat outside your estate for inheritance tax, while an ISA did not. That made spending the ISA and passing the pension on a tidy way to leave money to family.
That advantage is ending. From 6 April 2027, most unused pension funds and death benefits come within the estate for inheritance tax, under a change announced at the 2024 Budget and confirmed since (see the GOV.UK policy paper). For anyone planning a legacy, this weakens the old logic of preserving the pension purely to pass it on, and in some cases reverses it. It is one of the clearest examples in this whole guide of why a plan built on today's rules needs revisiting as the rules move, and why "set it and forget it" is the wrong way to treat a retirement strategy.
The 25% tax-free cash decision
The most over-simplified decision in UK retirement is what to do with the 25% tax-free lump sum. The instinct is to take all of it on day one and feel the relief of cash in hand. Often that is the worse move. A large sum pulled out of the pension immediately starts generating taxable returns outside the wrapper, and the pension loses the very money that would have grown tax-deferred.
Taking the tax-free cash in tranches over several years, rather than all at once, keeps more of the pot sheltered and working, and lets you match the tax-free withdrawals to the years you need them. This is situation-specific, and it is exactly the kind of decision where a regulated adviser running your real numbers tends to pay for itself.
9. Retiring early and the state pension bridge
Most people who want to retire early run into the same wall. There is a gap between the age they want to stop and the age the state pension starts, and that gap has to be funded entirely from their own pot. The bridge is where early retirement plans are won or lost.
The arithmetic of stopping early
Say you want to stop at 58. For a younger worker the state pension does not arrive until 67 or 68. That is a window of nine years or more where your spending comes entirely from private savings, with no state pension and, if you are under 55, possibly no pension access either. Those bridge years are the most demanding part of the whole plan, because the pot is funding 100% of your spending with no help.
This is why early retirement needs a larger total pot, a lower spending rate in the bridge years, or some income across that period, and usually a deliberate choice among the three. It is also why the ISA and GIA matter so much for early retirees. They are the only pots reachable before 55, so they have to carry the bridge until the pension unlocks.
Sequence of returns risk
There is a specific danger that stalks the early years of any drawdown, and it has an unglamorous name: sequence of returns risk. Two retirees can experience the exact same average return over thirty years and end up in completely different places, purely because of the order the good and bad years arrived.
The reason is that in drawdown you are selling units to live on. A 30% market fall in year one means you sell more units, at depressed prices, to fund the same spending, and those units are never there to recover when the market bounces. The same 30% fall after a decade of growth does far less damage, because the pot is bigger and you have been drawing from gains. Retiring straight into a downturn is the scenario that ruins otherwise sound plans.
Building the buffer
The standard defences are not exotic. Hold two to three years of spending in cash or short-dated bonds outside the equity portfolio, so a bad year does not force you to sell shares at the bottom. Some retirees go further and build what is sometimes called a bond tent, a deliberately higher allocation to bonds and cash in the few years either side of retirement, tapering back toward equities once the riskiest window has passed. And build flexibility into the plan, the willingness to trim discretionary spending in a down year, which mathematically does more to protect a portfolio than almost any clever investment choice. Neither defence removes the risk. Both blunt it.
10. How much to save now to get there
Everything so far has been about the size of the pot. The other half of the problem is the contribution that builds it, and this is the part you control directly today.
The contribution that closes the gap
The way to size your saving is to work backwards, from the target. Take the pot you need, subtract what you already have, allow for growth between now and your retirement age, and the remaining gap is what your contributions have to fill. The arithmetic is fiddly to do by hand because of compounding, which is exactly why a projection tool helps: it solves for the monthly figure that lands you on target at your chosen age, and shows you how that figure changes if you retire two years later or accept a slightly lower spending level.
The single most useful thing this reveals is how much a later date does on its own. Pushing your retirement age out by a couple of years often does more for the plan than a large jump in monthly saving, because it adds contributing years, adds growth years, and removes drawdown years all at once. Seeing that trade-off in pounds tends to change how people think about the date.
Salary sacrifice and the employer match
Two features turn ordinary pension saving into something far more efficient. The first is the employer match. If your employer adds money when you contribute above the minimum, that is an immediate return no investment can match, and capturing the full match comes before any other saving decision.
The second is salary sacrifice. Where your employer offers it, you give up part of your gross salary in exchange for an equivalent pension contribution. Because that money never counts as salary, it escapes both income tax and National Insurance, so more of your gross pay reaches your pension than through ordinary contributions. For a higher-rate taxpayer the combined effect is substantial, and it is one of the few free upgrades in personal finance.
Why starting early does the heavy lifting
Compounding rewards time more than it rewards size. A pound invested in your twenties has decades to grow, while the same pound in your fifties has only a few years, so early contributions do a wildly disproportionate share of the work. Start late and the answer is not to panic. It is to use the lever you actually have. At 30 that lever is time. At 50 it is how much you put in and when you stop, a harder lever to pull but a real one.
11. The variables that move your number
By now you have a method. Spending, minus state pension, divided by a sensible withdrawal rate, adjusted for tax. A handful of real-world variables can move the answer by six figures, and ignoring them is how a careful-looking plan ends up wrong.
Your home
The PLSA standards assume you own outright, and that assumption is doing enormous work. If you are still paying a mortgage in retirement, that cost sits on top of every figure in this guide. Clearing the mortgage before you stop work removes the single largest line from most retirement budgets and shrinks the pot you need accordingly. If you rent, the standards understate your costs substantially, and a realistic lifetime rent figure has to go on top before you size anything.
Your home is also a potential source of late-life capital, through downsizing or, more cautiously, equity release. Neither is a plan on its own, and equity release in particular carries compounding costs that deserve a regulated adviser and a clear head. But ignoring the value locked in your home can make your number look scarier than it is.
Care in later life
The Retirement Living Standards deliberately exclude residential care, and care is hard to plan for because you cannot know in advance whether you will need it or for how long. The average UK care home runs to well over £40,000 a year, and nursing care often £50,000 or more. This sits almost entirely outside what a standard pot calculation covers. The pragmatic response is to earmark a separate later-life reserve, or at least to acknowledge the risk explicitly rather than discover it at 85, and to understand how the means-tested care-funding rules treat your home and savings before you need to.
Inflation and longevity
Every figure in this guide is in today's money, which keeps the numbers legible, but it means you have to protect against inflation rather than ignore it. A 3.5% withdrawal rate is designed to rise with inflation, but a long stretch of above-forecast inflation erodes a fixed pot faster than planned. The state pension's triple lock shields part of your income. Your private pot does not have that shield, which is the core argument for holding real assets like equities across a long retirement rather than retreating to cash.
Longevity sits behind all of it. UK life expectancy data from the Office for National Statistics (ONS) shows that a healthy 60-year-old today has a meaningful chance of reaching their nineties, and planning to a too-short horizon is a common and dangerous error. The further you might live, the lower the withdrawal rate you want to plan around.
12. A worked example: a 38-year-old software engineer
Rules stay abstract until you run a real person through them. So here is one. None of this is a recommendation for anyone. It is the method running end to end on a single household.
The setup
Take a 38-year-old software engineer in the UK, on a salary in the basic-rate band. She has a workplace pension with employer matching and a stocks and shares ISA she has fed for several years. Her mortgage has 22 years to run. She wants to stop full-time work at 57. Under the current timetable her state pension is not due until 68, and possibly later if the age rises again, so she is funding an eleven-year bridge entirely from her own savings. Once the mortgage clears, around age 58, her target spending sits at roughly the PLSA moderate level for a single person, about £32,700 a year in today's money.
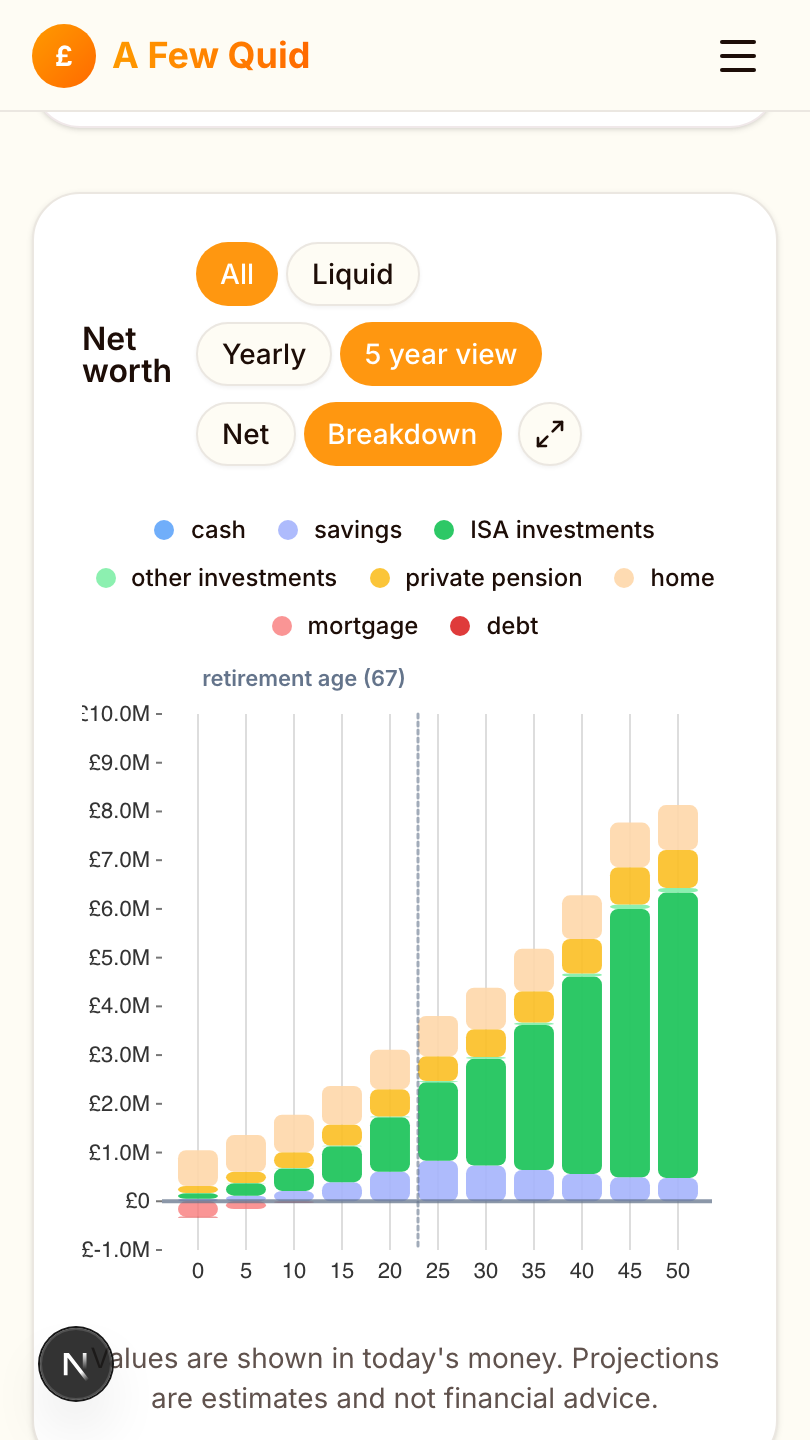
In A Few Quid she enters the real inputs: salary, pension contribution rate and employer match, monthly ISA contributions, the outstanding mortgage and its rate, and a target retirement age of 57. The projection dashboard then models pension, ISA, and net worth forward year by year, in today's money so the figures stay legible.
What the projection shows
The dashboard splits her projected net worth at 57 into the pension pot and the ISA, and the split is the point. Because she retires eleven years before her state pension, there is a long bridge to fund. The projection shows the ISA carrying those bridge years, drawing down at a rate that holds her spending near the moderate level while the pension stays untouched and keeps compounding tax-deferred until she is ready to access it from 57.
When the state pension finally arrives at 68, the picture changes sharply. Suddenly £12,548 of guaranteed, inflation-linked income appears in today's money, and the drawdown rate demanded of her private pot falls steeply. The pot only has to cover the gap above the state pension from that point on, not the whole bill. The bridge years are expensive. The years after the state pension are comfortable on far less. The net effect is that her required pot is smaller than a naive "annual spending divided by withdrawal rate" calculation would suggest, because the state pension shoulders a large share of the income from 68 onward.
The what-if simulator then lets her stress-test the plan. What if she stops at 55 instead of 57? What if she raises her ISA contributions for the next five years? What if inflation runs hot for a decade? Each scenario runs as a separate projection, so the trade-offs show up as a divergence in the lines rather than a single number she has to take on faith.
13. A second example: a higher-earning couple at 50
The first example is a single basic-rate taxpayer with a long runway. Change those facts and the plan changes shape, so here is a contrasting household.
The setup
A couple, both 50, one a higher-rate taxpayer and one a basic-rate taxpayer. They own their home with eight years left on the mortgage. They have decent workplace pensions and some ISA savings, and they want to stop work together at 60. Their target is the PLSA two-person comfortable standard, £62,700 a year, dropping toward moderate in their later, quieter years.
What changes when there are two of you
Three things shift compared with the single example.
First, two state pensions. If both reach the full new state pension, that is roughly £25,000 a year of guaranteed, inflation-linked income in today's money from their late sixties. Against a £62,700 target, the two state pensions cover a large slice once they begin, so the pot mainly has to fund the gap and the bridge years from 60 to state pension age.
Second, two sets of allowances. A couple has two personal allowances, two sets of tax bands, and two ISA allowances of £20,000 each. Splitting income and assets sensibly between them, so that the higher-rate partner is not drawing taxable pension income at 40% while the basic-rate partner has unused allowance, can save a serious amount of tax over a long retirement. This is a planning lever a single person simply does not have.
Third, the higher-rate partner's pension is especially powerful on the way in. Every pound they sacrifice into the pension while working saves 40% tax and, through salary sacrifice, National Insurance too. For the decade before they stop, leaning contributions toward the higher earner often builds the pot faster than splitting them evenly, though the income side then has to be balanced back the other way in retirement.
The mechanics are more involved than the single case, which is the point. A two-person household has more levers and more ways to waste tax, and modelling both people together rather than as two separate plans is what surfaces the difference. The what-if simulator handles a couple as one household, so the joint income, the two state pensions, and the combined drawdown all show up in a single projection.
14. Common ways people get the number wrong
After all of the above, it helps to name the mistakes directly, because they are predictable and expensive.
Planning off a salary multiple. It bakes in spending you will not do and ignores housing entirely. Start from spending, always.
Forgetting the state pension reshapes everything. It covers the gap below it, uses your personal allowance, and arrives on a fixed date that defines your bridge. Plan as if it is not there and you will massively oversave. Plan as if it is bigger than your forecast and you will undersave. Check the forecast.
Borrowing the American 4%. It was measured on a market and a tax system that are not yours. Use a UK figure, lean conservative if you are retiring young.
Confusing spending with income. Pension drawdown is taxed, so the gross you withdraw exceeds the net you spend. ISA money does not have this gap, which is why the bucket mix changes your headline pot.
Ignoring the bridge. The years between stopping and the state pension are funded entirely by you, and they are the most demanding part of an early-retirement plan.
Treating the pot as a straight line. Sequence risk, inflation, and the spending smile all mean the path matters as much as the average. A plan that only works on the average is not much of a plan.
Building on rules that are about to change. The April 2027 pension inheritance-tax change is a live example. Tax rules move, and a number you set once and never revisit will drift away from reality.
The thread running through every one of these is the same. A real number comes from your numbers, not from a headline. That is the entire reason the tool exists.
About the author and this calculator
I am Mike Gallagher, a software engineer based in the UK, and I built A Few Quid because I could not find a tool that answered the question this article is about in a way I trusted. The calculators I tried either asked for a salary multiple and produced a round number, or they were US tools wearing a Union Jack, assuming American returns and an American tax code under the surface. I wanted to see my own pension, my own ISA, my own mortgage, and the actual UK state pension and tax rules, projected forward year by year, with the ability to change one assumption and watch the consequences.
A Few Quid is that tool. It runs UK-specific projections on your real inputs, models the what-if scenarios that rules of thumb cannot, and ranks allocation strategies by projected outcome rather than telling you what to do. I am not a financial adviser, and A Few Quid is not authorised by the FCA, which I state plainly because it matters. The app is a calculator for exploring your own numbers, not a source of personal advice. For decisions with real consequences, a regulated adviser is worth their fee.
If you take one thing from this guide, let it be the habit underneath it. Treat every retirement number you read, including the ones in this article, as a starting assumption to test against your own situation, not as an answer to copy. The figures here are accurate as of June 2026 and sourced below, but tax bands, allowances, and the state pension all move, and your life is not the worked example. Build the number yourself, then keep it current. That is the only version of the number worth having.
FAQ
Is the state pension enough to retire on in the UK?
The full new state pension is £241.30 a week, around £12,548 a year in 2026/27. For a single retiree who owns their home outright and spends carefully, that sits close to the Pensions and Lifetime Savings Association (PLSA) minimum standard of £13,900. It does not stretch to the moderate or comfortable standards. Whether it is enough comes down entirely to your own spending. Someone mortgage-free in a low-cost area may find it covers most of what they need. Someone who rents, or who wants regular holidays and a newer car, will need a private pension or Individual Savings Account on top.
What is the 4% rule and does it work for UK retirees?
The 4% rule comes from US research by William Bengen in 1994, later tested by the 1998 Trinity Study. It found that a retiree with a balanced US portfolio could withdraw 4% of the starting pot, raise it with inflation each year, and very probably not run out over 30 years. For UK retirees the sustainable figure is generally lower, often quoted at 3.1 to 3.9%, because UK real returns have historically been weaker and UK inflation more volatile. The rate also needs adjusting for tax: 4% drawn from a pension produces less spendable income than 4% from an ISA, because pension drawdown is taxed and ISA withdrawals are not.
How do ISA and pension withdrawals differ for a UK retiree?
ISA withdrawals are completely tax-free and do not count as income. Pension withdrawals work differently. You can take up to 25% of the pot as a tax-free lump sum, capped at £268,275, but the rest is taxed as income at your marginal rate. Because the full state pension (around £12,548 in 2026/27) uses up almost all of the £12,570 personal allowance, any pension drawdown on top tends to be taxed from the first pound. ISA income sidesteps this entirely, which is why most UK plans lean on the ISA for the early, lower-income years.
Can I retire before the state pension age of 66?
Yes. The earliest you can currently reach a private or workplace pension is 55, rising to 57 in 2028. If you stop work at 55 or 60, there is a gap of several years before the state pension starts, and for younger workers that age is now 67 or 68 rather than 66. Across that bridge your income has to come from your pension, ISA, or other savings. The bridge raises the total pot you need at retirement, because those years are funded entirely by you with no state pension picking up part of the bill. Modelling the bridge years separately from the years after gives a far more accurate pot figure.
What does the PLSA moderate retirement standard include?
The Pensions and Lifetime Savings Association (PLSA) moderate standard is £32,700 a year for a single person and covers more than basics. It includes an annual overseas holiday, a newer car replaced roughly every decade, eating out a couple of times a month, and some day-to-day flexibility. The comfortable standard at £45,400 adds more foreign travel, a higher-spec car, and more spontaneous spending. Both assume you own your home outright and both are spending figures, not income, so the gross amount you draw to reach them is higher once tax is included.
Why is the UK safe withdrawal rate lower than the US 4%?
The 4% figure was derived from US market history, which delivered stronger real returns than the UK over the same century. UK-specific analysis, most notably by the Monevator blog using data back to 1870, puts the equivalent UK safe withdrawal rate closer to 3.1% for a 30-year retirement on a high-equity portfolio. The main driver is the UK's worse inflation record, because a safe rate depends on real returns, not headline ones. To draw 4% as safely as a US retiree, a UK retiree historically needed a pot roughly a third larger.
Will my pension be subject to inheritance tax?
Until April 2027, most unused pension funds sat outside your estate for inheritance tax, which made the pension an efficient way to pass money on. That changes from 6 April 2027, when most unused pension funds and death benefits come within the estate for inheritance tax. If leaving a legacy is part of your plan, this is a significant change. It weakens the old logic of spending other savings first and preserving the pension to pass on, and it is a good example of why a plan built on today's rules needs revisiting as the rules move. A regulated adviser can model what it means for your estate.
Is an annuity or drawdown better for a UK retiree?
Neither is universally better. An annuity converts a pension pot into a guaranteed income for life, removing the risk of running out and the risk of a bad run of markets, at the cost of flexibility and any pot left for your estate. Drawdown keeps the pot invested and flexible, with the upside of growth and a residual estate, but you carry the risk of poor returns and of living longer than planned. Many UK retirees use both: an annuity or a defined benefit pension to cover essential spending, and drawdown for the discretionary part. The right mix depends on how much guaranteed income you already have and how much certainty you want.
How is pension drawdown taxed when I first take it?
The first time you take taxable income from a pension, the provider usually applies an emergency tax code on a month-one basis, which assumes that single payment repeats every month for a year. That often over-taxes the withdrawal heavily. You reclaim the overpayment from HMRC, either automatically at the end of the year or sooner using the relevant claim form. It is not a permanent loss, but it can be a nasty surprise on a first large withdrawal, so plan around the cash-flow delay rather than the headline figure.
How does inflation affect my retirement pot?
A 3.5% withdrawal rate is designed to be inflation-adjusted, so you increase your nominal withdrawal by inflation each year to keep your buying power steady. If inflation runs above forecast for a long stretch, real returns on a balanced portfolio fall and the pot drains faster than planned. The state pension is shielded by the triple lock, rising each year by the highest of Consumer Prices Index inflation, average earnings, or 2.5%. Private savings carry no automatic inflation protection, which is the main argument for holding real assets like equities rather than cash across a long retirement.
How much should I save each month toward retirement?
There is no universal figure. The right amount depends on your age now, your target retirement age, the pot you already have, your expected state pension, and your target spending. The reliable way to find it is to model the gap between your projected pot at retirement and the pot you need at your chosen withdrawal rate, then solve for the monthly contribution that closes it. The A Few Quid dashboard shows your current trajectory and lets you raise contributions to see exactly when the line crosses your target. Capturing your full employer match comes first, because that is the highest guaranteed return available anywhere in a plan.
Glossary
- Safe withdrawal rate
- The percentage of a portfolio you can withdraw in the first year, then raise with inflation, without running out over a set horizon. US research put it near 4% for 30 years. UK-specific analysis puts the equivalent figure closer to 3.1 to 3.5%, because UK real returns have historically been lower.
- The 4% rule
- A planning shorthand from William Bengen's 1994 study and the 1998 Trinity Study. It says a balanced US portfolio could sustain an inflation-rising 4% withdrawal for 30 years across all historical start dates tested. It is a US, 30-year, historical-data result, not a UK guarantee.
- Sequence of returns risk
- The risk that poor returns in the first years of retirement permanently shrink the pot, even when long-run average returns are fine. A portfolio that falls 30% in year one of drawdown recovers far more slowly than one that falls after a decade of growth, because you are selling units to live on while prices are down.
- State pension
- The UK government pension paid from state pension age, currently 66 and rising to 67 by 2028 and 68 for younger workers. The full new state pension is £241.30 a week, around £12,548 a year in 2026/27, and needs 35 qualifying years of National Insurance to reach in full.
- ISA (Individual Savings Account)
- A UK tax wrapper where growth and withdrawals are completely tax-free. The annual allowance is £20,000. A stocks and shares ISA invests in markets and is the main vehicle for long-term tax-free wealth, as opposed to a cash ISA which suits short-term saving.
- SIPP (self-invested personal pension)
- A personal pension you control yourself, holding a wide range of investments. It carries the same tax treatment as any private pension: relief on the way in, tax-free growth, 25% tax-free at retirement, and the rest taxed as income on the way out.
- Drawdown
- Taking income directly from your invested pension or ISA pot rather than buying an annuity. Pension drawdown above the 25% tax-free element is taxed as income at your marginal rate.
- Annuity
- An insurance product that converts a pension pot into a guaranteed income for life. It removes longevity and sequence risk by passing them to the insurer, at the cost of flexibility and any leftover pot for your estate.
- PLSA Retirement Living Standards
- Benchmarks from the Pensions and Lifetime Savings Association, researched by Loughborough University, that price minimum, moderate, and comfortable retirement lifestyles for UK households. They exclude housing costs and describe spending, not income.
- Salary sacrifice
- An arrangement where you give up part of your gross salary in exchange for an equivalent employer pension contribution. Because the money never counts as salary, it escapes both income tax and National Insurance, making it one of the most efficient ways to fund a pension.
- Defined benefit pension
- A workplace pension that pays a guaranteed income for life based on your salary and years of service, rather than a pot you invest and draw down. Increasingly rare outside the public sector, it behaves more like a second state pension than an investment pot.
- Personal allowance
- The income you can receive before paying income tax, £12,570 in 2025/26 and frozen. The full new state pension sits just below it, so it uses up almost all of the tax-free band and leaves little room for untaxed pension drawdown.
- Triple lock
- The policy that raises the state pension each year by the highest of Consumer Prices Index inflation, average earnings growth, or 2.5%. It protects the real value of state pension income, unlike private savings which have no automatic uplift.
- Tax-free lump sum
- The part of a pension you can take tax-free, currently 25% of the pot and capped at £268,275 across all your pensions. The rest is accessed as taxable drawdown income.
Sources
- New State Pension: what you'll get — GOV.UK
- Over 12 million pensioners to receive £575 State Pension boost — GOV.UK
- Tax on your private pension contributions: Annual allowance — GOV.UK
- Individual Savings Accounts (ISAs) — GOV.UK
- Retirement Living Standards (2026 figures) — PLSA
- How much do you need in retirement — MoneyHelper
- Check your State Pension forecast — GOV.UK
- Inheritance Tax on unused pension funds and death benefits (from April 2027) — GOV.UK
- Determining Withdrawal Rates Using Historical Data (Bengen, 1994) — PDF
- Choosing a Withdrawal Rate That Is Sustainable (Trinity Study, 1998) — AAII PDF
- What's a safe retirement spending rate (2025) — Morningstar
- The Safe Withdrawal Rate for the UK — Monevator
Related reading
- What percentage of your salary to save for retirement — The UK numbers behind the rules of thumb, by age and starting point.
- Investing and retiring in the UK vs France — Tax, property and pensions compared across the Channel.