Living paycheck to paycheck in the UK, and why Britain keeps its savings in cash
How many people in the UK live paycheck to paycheck, how that compares with Europe and America, and why British savers keep so much of their money in cash.
A long-read data briefing, roughly an hour
A Few Quid is not authorised or regulated by the FCA. This article is general information, not advice.
"Living paycheck to paycheck" is one of those phrases everyone uses and nobody defines. Depending on which survey you read, the share of people it applies to is 24%, or 25%, or 35%, or 65%, and all four numbers are real. They just measure different things. The gap between them is not a rounding error or a bad sample. It is the difference between asking people how they feel about money and looking at what actually leaves their bank account. Once you notice that gap you start seeing it everywhere in personal finance coverage. This guide starts there, with the hard measures of how many UK households genuinely have no buffer. Then it sets them against France, Germany, Sweden and the United States. After that it follows the money that does get put aside, which turns out to be the more interesting question. Britain invented one of the most generous savings wrappers in the world. It comes with a £20,000 annual allowance and every penny of growth is tax-free. Then the country filled it up with cash. Two-thirds of the people holding an Individual Savings Account (ISA) own no shares through it at all. UK households keep a higher share of their financial wealth in deposits than French households do. Working out why is most of what follows.
This article is general information, not advice. Nothing here is a personal recommendation about what to do with your money. A Few Quid is a calculator, not an adviser, and it is not regulated by the Financial Conduct Authority (FCA), so it is not FCA-authorised. Investments can fall as well as rise, and past returns tell you nothing certain about future ones.
How to read this guide
This is a long piece, so here is the shape of it before you start.
The first block establishes how many people are actually under pressure. It spends a while on the measurement problem, because the measurement problem is the story. How many people in the UK live paycheck to paycheck gives the hard UK numbers from the regulator and the national statistics office. Why the paycheck-to-paycheck figure changes depending on who counts it explains why the same country can be 24% or 65% fragile, and how to tell which sort of number you are reading. Then two comparisons. How the UK compares with the rest of Europe on financial resilience uses Eurostat's 2025 figures across 30 countries, and explains why the UK is missing from them. How the UK compares with the United States does the same for America, where the answer is closer than the headlines suggest.
The middle block follows the money that does get put aside. This is where the guide's argument lives. Where British households actually keep their money puts the UK household balance sheet next to seventeen others. The result is the single most surprising number in this piece. How many people have an ISA, and who they are goes through HMRC's holder-level tables, including how many holders put nothing in. Cash ISAs against stocks and shares ISAs, and the income where the split flips finds the income at which British savers stop being cash savers, which is much higher than most people would guess. How ISA money is spread across ages and incomes covers who the wrapper is actually working for. The Lifetime ISA, and why more people pay its penalty than buy a home with it is the closest thing here to a scandal.
Then the cost and the comparison. What holding cash instead of investing has cost does the return arithmetic over a century and over the last twenty years, which disagree in an instructive way. How households in France, Germany, Sweden and America invest looks at what the same household would do in five different countries and why. Whether the French would really be richer if they invested like Americans takes the popular claim seriously and finds it half right. Why so many people keep money in cash when they know the arithmetic turns out to hinge on the fact that most of them do not know the arithmetic. What changes in April 2027 and April 2028 covers the two rule changes already legislated or consulted on.
The last block is yours to use. Two worked examples, saving in a cash ISA and the same saver, invested, follow one person through both outcomes. Every dial is named, and there is a full grid of combinations. Then how to decide what any of this means for you brings it back to a decision you can make this week.
1. How many people in the UK live paycheck to paycheck
Start with the two most credible UK sources. They run independently and land in almost the same place.
The FCA runs the Financial Lives survey every two years using random probability sampling of addresses. Its 2024 round involved 17,950 interviews, with fieldwork from February to June 2024. It found that 13.1 million adults, 24% of the UK, had low financial resilience in May 2024. The FCA's definition is precise. An adult qualifies if they have missed payments on domestic bills or credit commitments in three or more of the past six months. They also qualify if they feel heavily burdened by what they already owe, or have very limited savings. Some people meet two of those, some meet all three.
The ONS asks a different question monthly through its Opinions and Lifestyle Survey. In fieldwork from 6 to 31 May 2026, 25% of adults in Great Britain said their household would be unable to pay an unexpected but necessary expense of £850. A year earlier the figure was 24%. In the same survey, 35% expected to be unable to save any money at all over the following twelve months, up from 33% a year before. And 13% disagreed that their household income covered their minimum living expenses.
Two surveys, two different questions, two different fieldwork periods, and both land at roughly a quarter of the adult population.
The savings distribution behind the headline
Averages hide the shape, so it helps to look at the distribution directly. The FCA's 2024 survey found that 10% of UK adults had no cash savings at all, unchanged since 2022. Another 21% had under £1,000. Among the 90% who did have savings, the median holding was between £5,000 and £6,000.
The FCA also counts investible assets, meaning cash savings plus the market value of any investments. On that wider definition, 29% of all UK adults had either nothing or under £1,000. The figure varies enormously by circumstance.
| Group | Share with no investible assets or under £1,000 |
|---|---|
| All UK adults | 29% |
| Lone parents | 69% |
| Long-term sick, disabled, or full-time carers | 69% |
| Unemployed | 67% |
| Black adults | 54% |
| Adults in work | 27% |
| Retirees | 11% |
| Aged 75 and over | 9% |
That spread is the point. The national figure of 29% is an average of populations whose experiences barely overlap. Two-thirds of lone parents and two-thirds of unemployed adults have no buffer worth the name. Nine in ten retirees do. Any policy or product aimed at "people with no savings" is really aimed at several very different groups at once.
What the buffer is for
The £850 threshold in the ONS question is not arbitrary. It is roughly the cost of the sort of thing that goes wrong in an ordinary year. A boiler, a car repair, a broken washing machine, a funeral contribution, a month of rent covered while between jobs. The point of the question is not whether £850 is a lot of money. It is whether a household has any capacity at all to absorb a shock without borrowing, which is the first thing the dashboard projection makes visible.
That framing matters for what comes later in this guide. The people who cannot meet an £850 bill are not the audience for a conversation about cash ISAs against stocks and shares ISAs. For them the live question is income rather than allocation. But the two groups get blurred together constantly in coverage of British savings habits, and blurring them makes both problems harder to see.
2. Why the paycheck-to-paycheck figure changes depending on who counts it
If a quarter of UK adults have no buffer, why do you keep seeing numbers around two-thirds? Because those numbers come from a different kind of exercise.
The most-quoted American figure comes from the LendingClub and PYMNTS "New Reality Check" series, which reported around 65% of consumers living paycheck to paycheck as of late 2024. It asks people to judge themselves against one test, whether they need their next paycheck to meet their monthly obligations. When researchers asked LendingClub for the exact question wording, they were told it was proprietary information. In the same surveys, only about 18.5% of respondents said they had trouble paying their bills.
Now put that next to a measurement. Bank of America Institute took a sample of households whose main banking relationship is with the bank. It defined necessity spending to cover housing, groceries, fuel, utilities, insurance, childcare, transport, vehicle costs, tax payments and external credit card payments. Then it counted the households where that spending exceeded 95% of income. Their answer for 2025 was nearly 24% of US households, up 0.3 percentage points on 2024. On a looser threshold of 90% of income, the pattern moved the same way.
So the same country produces 65% and 24% in the same period. Both are collected in good faith. They are answering different questions.
How to read any resilience statistic
Three questions sort the useful numbers from the rest.
Why the distinction changes what you do about it
This is not pedantry about statistics. The two framings point at different problems and different solutions.
If two-thirds of households genuinely cannot cover their bills, the problem is wages and prices, and nothing an individual does with their savings allocation matters much. Suppose instead that a quarter cannot, and the rest are simply running a fully committed budget. Then a large group of people are financially fine and behaving as though they are not, which is a different problem entirely. The FCA's own data supports the second reading. Around 43% of UK adults had £10,000 or more in investible assets in 2024. Of everyone at or above that £10,000 mark, 61% held at least three-quarters of it in cash. Those are not people without money. They are people with money and no plan for it.
Bank of America's data adds one more useful detail. The rise in paycheck-to-paycheck households sits almost entirely among lower-income households. Their share reached 29% in 2025, against 28.6% in 2024 and 27.1% in 2023. Middle- and higher-income households barely moved. Financial pressure is not spreading evenly through the population. It is deepening in one part of it.
3. How the UK compares with the rest of Europe on financial resilience
Eurostat runs a directly comparable question across Europe as part of EU-SILC, the European Union Statistics on Income and Living Conditions. Households are asked whether they could face an unexpected required expense from their own resources. Each country sets its own threshold, at around the monthly at-risk-of-poverty line. It is close in design to the ONS £850 question, though not identical.
Here are the 2025 results, published in June 2026, for the countries with the highest and lowest shares plus the major economies.
| Country | Unable to face an unexpected expense, 2025 | 2019 |
|---|---|---|
| Greece | 50.5% | 47.8% |
| Latvia | 43.7% | 49.8% |
| Bulgaria | 42.4% | 36.5% |
| Spain | 36.4% | 33.9% |
| Estonia | 36.0% | 31.4% |
| Germany | 31.9% | 26.0% |
| Ireland | 30.6% | 37.1% |
| European Union (27) | 29.2% | 30.8% |
| Portugal | 29.2% | 33.0% |
| France | 28.8% | 30.6% |
| Finland | 28.0% | 26.4% |
| Italy | 25.6% | 33.8% |
| Sweden | 23.0% | 20.5% |
| Poland | 22.5% | 29.3% |
| Belgium | 22.1% | 25.3% |
| Denmark | 20.1% | 22.9% |
| Czechia | 18.7% | 21.8% |
| Netherlands | 15.3% | 21.9% |
Two things stand out. The EU average has barely moved in six years, from 30.8% to 29.2%, despite a pandemic and an inflation shock in between. And the spread between countries is enormous, from 15.3% in the Netherlands to 50.5% in Greece. That is a wider range than any plausible measurement error.
Why the UK is not in that table
The UK stopped reporting to EU-SILC after 2018. Its last comparable reading was 34.6% unable to face an unexpected expense in 2018, against an EU average of 32.2% that year. The last time the UK was measured on the same instrument as everyone else, it came out worse than the European average.
That is a seven-year-old number and should be treated as such. No strictly comparable current UK figure exists. What we have instead are two near-misses. The ONS's £850 measure stood at 25% in May 2026, similar in design but with a fixed sterling threshold rather than a nationally derived one. The FCA's low-financial-resilience measure stood at 24%, a composite of arrears, burden and savings rather than a single-expense test.
Placing 24% or 25% into the European table would put the UK somewhere between Belgium and Sweden, in the better third. Placing 34.6% there would put it above Germany and just below Estonia. The truth is probably nearer the first. Britain's figure has almost certainly improved since 2018 on the same trend as most of Europe, though nobody can say by how much. Any article that drops a current UK figure straight into a Eurostat league table is comparing two different instruments and not telling you.
What the European spread actually tracks
Countries at the resilient end of that table are not simply the rich ones. The Netherlands, Denmark, Czechia and Poland sit in the best six, and Poland's national income per head is far below Germany's. Denmark and the Netherlands share something more specific. Both run a savings system that builds assets automatically for almost everyone, through funded pensions. Czechia and Poland have low housing costs relative to income for a large owner-occupier majority.
Germany, meanwhile, has moved the wrong way, from 26.0% in 2019 to 31.9% in 2025. That is one of the largest deteriorations in Europe. Germany also holds the highest cash share of household financial assets of any large European economy. Those two facts are not unrelated, and the connection runs through the middle of this guide.
4. How the UK compares with the United States
The Federal Reserve runs an annual Survey of Household Economics and Decisionmaking, usually shortened to SHED. Its 2025 edition was fielded in October 2025 and published in May 2026. It found that 63% of American adults could cover a hypothetical $400 emergency expense using cash, savings, or a credit card paid off at the next statement. That leaves 37% who could not. The same survey found 73% of adults reported doing okay or living comfortably financially. That is unchanged from 2024 but below the 78% peak in 2021.
Set the comparable figures side by side.
| Measure | Country | Latest figure |
|---|---|---|
| Cannot cover a $400 emergency with cash or equivalent (Federal Reserve, 2025) | United States | 37% |
| Necessity spending above 95% of income (Bank of America Institute, 2025) | United States | 24% |
| Cannot pay an unexpected £850 expense (ONS, May 2026) | Great Britain | 25% |
| Low financial resilience (FCA, May 2024) | United Kingdom | 24% |
| Cannot face an unexpected expense (Eurostat, 2025) | European Union | 29.2% |
The $400 figure is the odd one out, and worth understanding. It sets a much lower bar in money terms, roughly £300. But it demands the money be available immediately, in cash or on a card cleared at the next statement. A small amount from a strict source makes for a harsher test of liquidity than the £850 question, which asks only whether the household could pay.
On the measures closest in design, the UK and the US are within a percentage point of each other. Both sit slightly better than the EU average. The idea that Americans are dramatically more financially fragile than Britons does not survive contact with the comparable data.
Where the two countries actually diverge
The difference is not in how many households have nothing. It is in what happens to the households that have something.
American households held 10.4% of their financial assets in currency and deposits at the end of 2025. UK households held 34.7%. That is a structural gap of an entirely different order from the one or two percentage points separating the hardship measures.
Part of that gap is the American retirement system, where the 401(k) and the individual retirement account push tens of millions of ordinary earners into equity funds by default. But only part. American households also hold 32.2% of their financial assets in directly held listed shares, against 4.2% in the UK. Even setting pensions aside entirely, the ordinary American saver owns shares and the ordinary British saver owns a deposit account.
Gallup's 2025 poll, conducted in April that year, found 62% of American adults owned stock, either directly or through a fund or retirement account. That matched 2024 and sat close to 61% in 2023. The FCA's equivalent for the UK counts anyone holding an investment other than property. It came to 35% in 2024, down from 37% in 2022. Both figures are self-reported and the questions are not identical, so treat the gap as indicative rather than exact. It is a very large gap to be entirely artefact.
5. Where British households actually keep their money
The OECD publishes quarterly household financial balance sheets on a common basis. That makes it possible to line up eighteen countries and ask each the same question. What share of everything households own in financial form sits in currency and deposits, and what share sits in shares and investment funds they hold directly?
Financial assets here means deposits, shares, investment funds, bonds, life insurance and pension entitlements. It excludes the house, which for most UK households is the single largest asset they own. These are figures for the end of 2025.
| Country | Currency and deposits | Listed shares | Investment funds | Shares and funds combined | Insurance and pensions |
|---|---|---|---|---|---|
| United States | 10.4% | 32.2% | 13.3% | 45.6% | 27.0% |
| Sweden | 12.4% | 7.9% | 10.7% | 18.7% | 38.6% |
| Denmark | 13.0% | 6.1% | 7.5% | 13.6% | 40.9% |
| Canada | 19.7% | 10.5% | 23.6% | 34.1% | 27.4% |
| Netherlands | 20.6% | 2.2% | 4.1% | 6.2% | 50.4% |
| Norway | 23.9% | 4.2% | 9.6% | 13.8% | 32.3% |
| Italy | 24.7% | 2.9% | 13.9% | 16.8% | 18.1% |
| Finland | 28.7% | 14.9% | 15.4% | 30.3% | 15.7% |
| France | 29.1% | 3.6% | 6.3% | 9.9% | 31.3% |
| Belgium | 29.9% | 5.5% | 19.9% | 25.3% | 17.5% |
| Spain | 33.3% | 6.2% | 17.1% | 23.3% | 11.6% |
| United Kingdom | 34.7% | 4.2% | 4.8% | 8.9% | 44.5% |
| Germany | 36.4% | 7.1% | 14.5% | 21.6% | 26.4% |
| Ireland | 36.7% | 2.4% | 2.9% | 5.3% | 45.3% |
| Austria | 37.3% | 5.8% | 12.2% | 18.0% | 14.7% |
| Portugal | 42.7% | 1.8% | 7.4% | 9.2% | 10.1% |
| Japan | 48.0% | 0.0% | 7.3% | 7.3% | 23.7% |
| Poland | 49.0% | 3.0% | 6.3% | 9.2% | 13.6% |
UK households held £6.75 trillion in financial assets at the end of 2025. Of that, £2.34 trillion sat in currency and deposits.
Read the UK row against France. Britain is the country with the £20,000 tax-free ISA. France taxes investment gains at a headline 31.4%, and French households are a byword across Europe for caution. Britain still holds the higher cash share of the two. It also holds less in directly held shares and investment funds than France does, 8.9% against 9.9%, and about a fifth of the American figure.
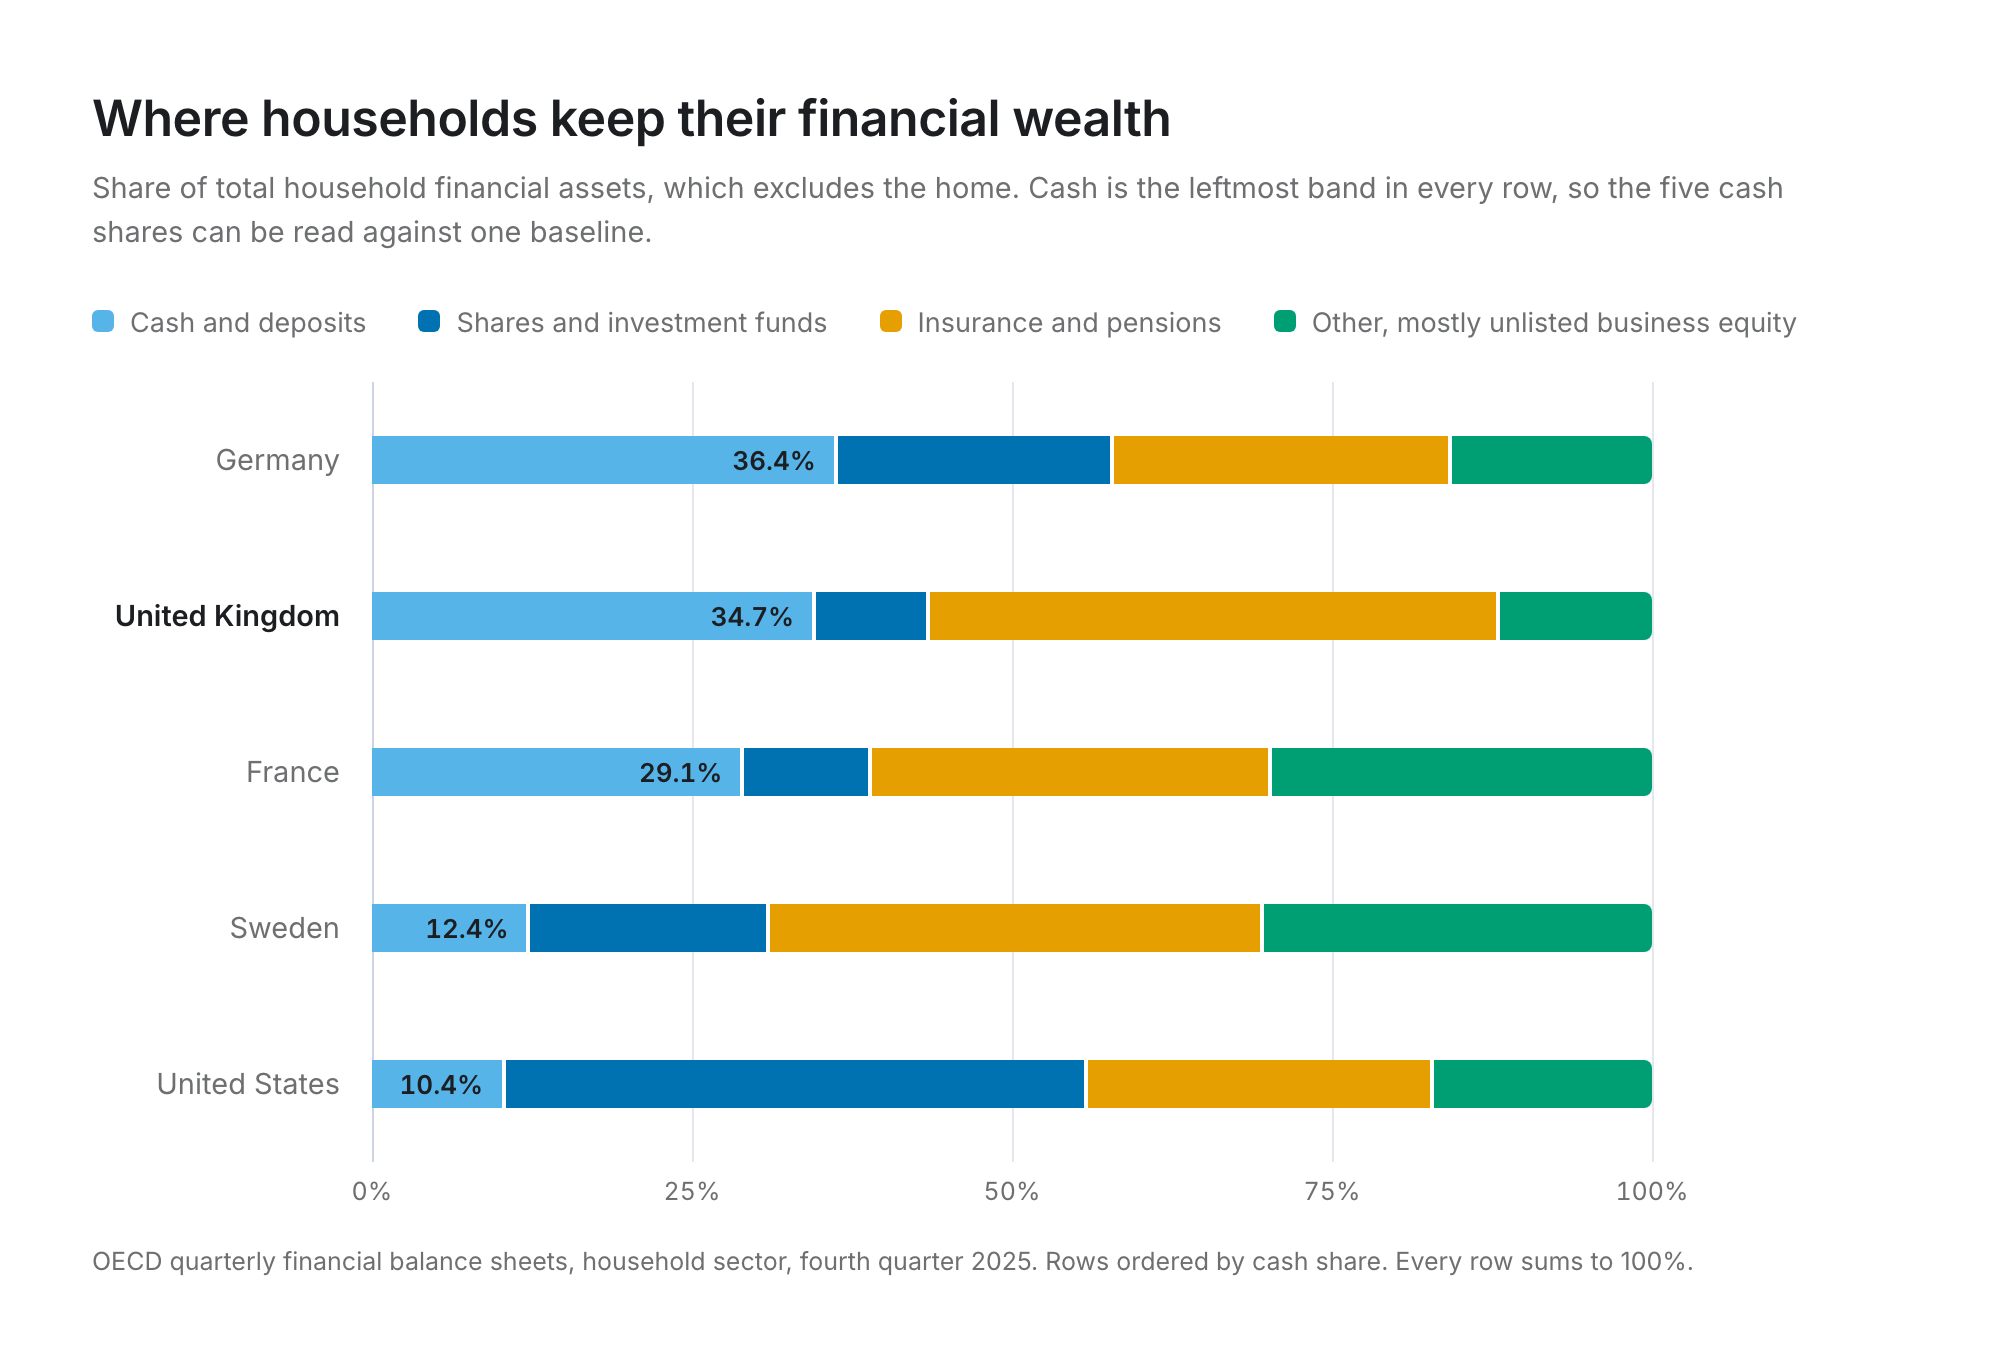
Five of those eighteen rows, drawn out in full, make the shape of the difference clearer than the table does. The blue band on the left is cash, and it is the leftmost band in every row so the five shares can be read against a single baseline. Germany and the UK sit at one end. Sweden and the United States sit at the other, with roughly a third of Britain's cash share. What replaces the cash differs by country, though. The Americans hold shares and funds. The British hold pensions.
The pension line does a lot of work
The one column where the UK looks unusual in a good way is insurance and pensions, at 44.5%, behind only the Netherlands. Auto-enrolment requires employers to enrol eligible staff into a workplace pension unless they opt out. Participation among eligible employees has reached 90% in 2025, some 22.6 million savers, on the Department for Work and Pensions' figures. The default funds those contributions land in are mostly invested in global equities.
So the picture is not that British households own no shares. They own shares almost exclusively through a workplace pension whose contents they never chose, and they hold their own discretionary money in cash. Strip out pensions and life insurance and the UK's household portfolio is one of the most deposit-heavy in the developed world.
That distinction matters in practice. Pension money is locked until 55, rising to 57 in April 2028. The money in the deposit column is the money available for everything between now and then, which is most of what people actually plan for. A house deposit, a career break, a business, school fees, an early retirement bridge. All of it is being held in the asset class with the lowest long-run return.
That choice rarely feels urgent at the moment it is made. A deposit account and a fund holding the same money look much the same for the first few years. The difference only becomes visible long after the point where it could have been closed easily.
6. How many people have an ISA, and who they are
The ISA turned 26 this year. It launched on 6 April 1999, replacing two older wrappers. Personal Equity Plans had offered tax-free equity investing since 1986, and Tax-Exempt Special Savings Accounts had done the same for cash deposits since 1990. The first-year allowance was £7,000, of which £3,000 could be cash. Today the allowance is £20,000 across all types, and there are four of them. Cash, stocks and shares, innovative finance, and the Lifetime ISA.
HMRC publishes the usage data every September in its Annual savings statistics. The most recent release, published on 18 September 2025, covers subscriptions in 2023/24 and holder-level detail for 2022/23. A new release is due in September 2026, so some of what follows will be a year fresher shortly.
Start with the headline count. Around 21.3 million adults held an ISA of some kind in 2022/23. Some 15 million adult ISA accounts received a subscription during 2023/24, up from 12.4 million the year before and the highest for thirteen years.
Half of ISA holders put nothing in
The subscription number and the holder number measure different things. That gap is the first thing worth noticing. Of the 21.3 million holders in 2022/23, 10.4 million made no further subscription that year. Just under half of everyone with an ISA left it alone entirely.
Of the 10.9 million who did contribute, the distribution was heavily skewed towards small amounts.
| Amount subscribed in 2022/23 | Number of subscribers | Share of subscribers |
|---|---|---|
| Under £2,500 | 4,579,683 | 41.9% |
| £2,500 to £4,999 | 1,290,379 | 11.8% |
| £5,000 to £9,999 | 1,127,643 | 10.3% |
| £10,000 to £17,499 | 996,786 | 9.1% |
| £17,500 to £19,999 | 450,382 | 4.1% |
| The full £20,000 | 2,484,848 | 22.7% |
Two-fifths of subscribers put in under £2,500 in the year, which is under £210 a month. Just under a quarter used the whole allowance. Set against all holders rather than all subscribers, only 11.7% used the full £20,000.
That is worth holding onto when you read commentary about the ISA allowance being too generous. For the large majority of people who have one, the allowance is not a binding constraint on anything. The binding constraint is how much they have spare.
What the balances look like
The average adult ISA was worth £34,044 at the end of 2022/23. The median was very much lower, because the distribution is severely skewed.
| Market value held | Number of holders | Share of holders |
|---|---|---|
| Under £2,500 | 8,264,889 | 38.8% |
| £2,500 to £9,999 | 3,170,819 | 14.9% |
| £10,000 to £24,999 | 3,559,840 | 16.7% |
| £25,000 to £49,999 | 2,304,525 | 10.8% |
| £50,000 or more | 3,998,677 | 18.8% |
Nearly two-fifths of ISA holders have under £2,500 in the wrapper. At the other end, 4 million people have £50,000 or more. That group produces both the £34,044 average and the £872 billion national total. The ISA is a mass-participation product and a wealth-concentration product at once. Which one you think it mostly is depends on whether you count people or pounds.
7. Cash ISAs against stocks and shares ISAs, and the income where the split flips
Here is the single most revealing table in HMRC's data. Of the 21.3 million ISA holders in 2022/23, how many held cash, how many held investments, and how many held both?
| Holder type | Number | Share of all ISA holders | Average pot |
|---|---|---|---|
| Cash only | 13,365,044 | 62.8% | £14,948 |
| Stocks and shares only | 4,356,973 | 20.5% | £59,391 |
| Both cash and stocks and shares | 3,576,734 | 16.8% | £74,526 |
| All holders | 21,298,750 | 100% | £34,044 |
Just under 63% of ISA holders have no stock market exposure through the wrapper at all. Their average pot of £14,948 rules out the comfortable explanation, that these are a handful of small dormant accounts. It is the modal British ISA experience.
The average-pot column invites an obvious objection. People with stocks and shares ISAs are richer to begin with, so of course their pots are larger. That is true, and it is why the ratio between £59,391 and £14,948 is not a return differential. But it does not explain the pattern in the next table.
Where the cash habit breaks
Split the same 21.3 million holders by income and count how many cash-only holders there are for every stocks-and-shares-only holder.
| Income band | Cash-only holders | Shares-only holders | Cash-only per shares-only holder |
|---|---|---|---|
| £0 to £4,999 | 856,671 | 267,413 | 3.20 |
| £5,000 to £9,999 | 1,180,459 | 289,187 | 4.08 |
| £10,000 to £19,999 | 3,740,912 | 900,496 | 4.15 |
| £20,000 to £29,999 | 3,034,579 | 761,655 | 3.98 |
| £30,000 to £49,999 | 2,940,243 | 979,052 | 3.00 |
| £50,000 to £99,999 | 1,342,984 | 776,117 | 1.73 |
| £100,000 to £149,999 | 169,166 | 179,418 | 0.94 |
| £150,000 or more | 100,030 | 203,636 | 0.49 |
The ratio stays at three or four to one across the entire range from £10,000 to £49,999 of income. That covers most of the working population. It falls below one for the first time in the £100,000 to £149,999 band. Above £150,000 it inverts completely, with two shares-only holders for every cash-only one.
Put plainly, the point at which British savers stop being cash savers is somewhere around a six-figure income. Below that, whatever the tax logic says, the deposit account wins.
The full-allowance pattern says the same thing
The share of subscribers using the entire £20,000 allowance tells a similar story from a different angle.
| Income band | Share of subscribers using the full £20,000 |
|---|---|
| £0 to £4,999 | 17.1% |
| £5,000 to £9,999 | 19.0% |
| £10,000 to £19,999 | 21.9% |
| £20,000 to £29,999 | 18.2% |
| £30,000 to £49,999 | 20.4% |
| £50,000 to £99,999 | 28.1% |
| £100,000 to £149,999 | 40.5% |
| £150,000 or more | 59.9% |
Three-fifths of ISA subscribers earning over £150,000 fill the whole allowance. The oddity is the £10,000 to £19,999 band at 21.9%, which is higher than the £20,000 to £29,999 band. That is not an error. Taxable income is a poor proxy for wealth at the bottom of the scale. That band holds a lot of retired people, non-earning spouses and people living on capital. Their income figure says almost nothing about the size of the pot they move into the wrapper each year.
Which way the flow is going
The 2023/24 subscription year, when Bank Rate peaked, shows the cash habit intensifying rather than easing.
| Measure | 2022/23 | 2023/24 | Change |
|---|---|---|---|
| Cash ISA accounts subscribed to | 7.86m | 9.94m | +26.4% |
| Stocks and shares ISA accounts subscribed to | 3.81m | 4.09m | +7.4% |
| Money into cash ISAs | £41.6bn | £69.5bn | +67.0% |
| Money into stocks and shares ISAs | £28.0bn | £31.1bn | +10.9% |
Cash took 67.5% of all money subscribed and 66.2% of all accounts in 2023/24. High interest rates pulled money towards deposits, which is a rational response to a rate of over 5% at the time. What makes it worth watching is that rate-driven flows into cash tend not to reverse when rates fall. The money is by then sitting in an account nobody is thinking about.
8. How ISA money is spread across ages and incomes
Age does most of the explaining in ISA balances. That is what you would expect from a product built for accumulation over time.
| Age band | Average ISA market value |
|---|---|
| Under 25 | £8,288 |
| 25 to 34 | £10,556 |
| 35 to 44 | £14,254 |
| 45 to 54 | £25,316 |
| 55 to 64 | £41,311 |
| 65 and over | £64,386 |
| All ages | £34,044 |
The 65-and-over average is 6.1 times the 25-to-34 average. Some of that is decades of contributions and compounding, exactly as designed. Some of it is that older cohorts have had access to tax-free wrappers for longer and at more generous real allowances relative to earnings. And some of it is the transfer of Personal Equity Plan and Tax-Exempt Special Savings Account balances into ISAs in 1999. That handed the then middle-aged a head start the young have never had.
The subscription pattern is younger than the balance pattern
Contribution behaviour looks quite different from balances. In 2022/23, the 25-to-34 age group contained 2.12 million ISA subscribers, more than any band except the over-65s. Of those, 641,157 subscribed to a stocks and shares ISA. That is a higher stocks-and-shares subscription count than the 35-to-44s, the 45-to-54s, or the 55-to-64s.
Younger savers are more likely to use a stocks and shares ISA when they use one at all. Cash dominates most heavily, relative to the amounts involved, in the group between 35 and 54, the one with mortgages, children and the least spare attention.
The gender split
The FCA data and the HMRC data agree on this. In 2022/23, 4.02 million women subscribed to a cash ISA against 3.10 million men. Stocks and shares went the other way, with 1.79 million men against 1.28 million women. The average ISA pot was £35,652 for men and £32,533 for women.
The FCA's investible-assets data shows a wider version of the same pattern and one that is getting worse. In May 2024, 49% of men had £10,000 or more in investible assets, with a median between £5,000 and £10,000. For women the figures were 39% and a median between £2,000 and £5,000. In 2017 the split was 40% of men and 32% of women, both with medians in the same band. The gap in participation has held and the gap in median value has opened up.
What income does to the pot
| Income band | Average ISA market value | Average pot, cash-only holders | Average pot, shares-only holders |
|---|---|---|---|
| £0 to £4,999 | £18,059 | £7,548 | £35,341 |
| £10,000 to £19,999 | £31,563 | £16,667 | £55,175 |
| £30,000 to £49,999 | £34,103 | £14,293 | £57,442 |
| £50,000 to £99,999 | £42,747 | £16,292 | £64,181 |
| £100,000 to £149,999 | £60,160 | £21,930 | £82,007 |
| £150,000 or more | £94,894 | £29,938 | £122,211 |
Notice the middle of that table. Between £10,000 and £49,999 of income the average ISA pot barely moves, from £31,563 to £34,103. The cash-only average actually falls across that range. What changes across those bands is whether people hold investments. Earnings barely come into it. The shares-only column runs at roughly three to four times the cash-only column in every income band.
That is a comparison between different people, not a controlled experiment. Households that choose investments differ from those that choose cash in ways that also predict wealth. Age, financial confidence and the steadiness of their income all come into it. But the size and consistency of the gap across every income band is hard to explain away entirely as selection.
9. The Lifetime ISA, and why more people pay its penalty than buy a home with it
The Lifetime ISA arrived in April 2017 with an unusually attractive headline. Open one between 18 and 39, put in up to £4,000 a year until you are 50, and the government adds 25%, up to £1,000 a year. Use the money to buy a first home worth up to £450,000, or take it from age 60. Take it out for anything else and a 25% withdrawal charge applies.
That charge is where the trouble lives. It applies to the whole withdrawal rather than just the bonus, so taking money out early costs you roughly 6.25% of your own contributions on top of the bonus you lose. Put in £4,000, receive £1,000, withdraw the £5,000 for any reason other than a qualifying purchase or turning 60, and £1,250 goes to HMRC. You get £3,750 back from £4,000 of your own money.
The numbers
HMRC publishes Lifetime ISA withdrawals every year. Here is every year since the statistics began.
| Tax year | Withdrew for a first home | Made a penalised withdrawal | Withdrawal charges paid |
|---|---|---|---|
| 2018/19 | 8,200 | 6,800 | £5.3m |
| 2019/20 | 22,350 | 14,400 | £10.1m |
| 2020/21 | 34,100 | 41,700 | £34.5m |
| 2021/22 | 50,250 | 47,850 | £33.5m |
| 2022/23 | 55,700 | 76,100 | £54.4m |
| 2023/24 | 56,750 | 99,700 | £75.3m |
| 2024/25 | 87,250 | 129,200 | £102.0m |
| Total | 314,600 | 415,750 | £315.1m |
Over the product's measured life, 415,750 account holders have paid a withdrawal charge against 314,600 who bought a first home. HMRC has collected £315.1 million from them. In 2024/25 alone there were 1.48 penalised withdrawals for every first-home purchase.
Some of those penalised withdrawals are people who changed their plans, and a savings product cannot be blamed for that. But a large share saved diligently for a house and then found the one they wanted cost more than £450,000. That cap has not moved since 2017, while UK house prices have risen a long way. Others hit a genuine emergency and discovered that the emergency fund they had built came with a 6.25% exit fee on their own money.
The average first-home withdrawal in 2024/25 was £15,782 and the average penalised withdrawal was £3,159. People paying the charge are, on average, taking out a fifth of what the successful buyers take out. This is not, in the main, wealthy people changing their minds. It is small balances being raided under pressure.
What is replacing it
The Treasury Committee looked at the Lifetime ISA in 2025 and was blunt. It called the product complex and criticised both the withdrawal charge and the frozen £450,000 cap. One of its proposals was to cut the charge from 25% to 20%, so that only the bonus was clawed back and no penalty fell on the saver's own money.
The government went further. On 23 June 2026 it published a consultation on a First-Time Buyer ISA, which will be offered in place of the Lifetime ISA from April 2028. The consultation closed on 18 August 2026 and the response has not been published, so the final design is not yet fixed. What has been set out is this. The new product drops the upper age limit of 40 and removes the 25% withdrawal charge. It pays the bonus as a lump sum on completion rather than monthly, and only first-time buyers purchasing with a mortgage can use it. The retirement leg goes entirely.
10. What holding cash instead of investing has cost
Two datasets answer this, and they disagree. The disagreement is more useful than either would be alone.
The long view comes from the Barclays Equity Gilt Study, which has tracked UK asset returns since 1899. Over that period UK equities returned 5.1% a year after inflation, gilts 1.2%, and cash 0.8%. The same study finds that the probability of UK equities beating cash rises from about 70% over any two-year period to around 90% over any ten-year period.
The recent view comes from Barclays' own follow-up, The missed opportunity of not investing, published on 9 April 2026. Its cash proxy lost 40.5% of its real value between 2004 and 2024, even counting the interest paid. That works out at about 2.6% a year of purchasing power gone. An illustrative 60/40 UK equity and gilt portfolio gained 21.6% in real terms over the same twenty years, about 1.0% a year. Barclays puts the gap at 62.1 percentage points of total return and about 3.6 percentage points a year.
Read those two together carefully. The long-run figures say equities beat cash comfortably. The twenty-year figures say a UK-only mixed portfolio barely kept pace with inflation while cash went sharply backwards. None of that means investing always wins by a lot. Two things follow instead. Cash has been reliably bad, and a UK-concentrated portfolio was itself a poor version of investing over the last two decades. A globally diversified investor did considerably better than that 60/40 domestic mix, which is why Barclays is careful to call its own comparators illustrative.
What that means in pounds
Every figure below is in today's money. Inflation is assumed at 2%, the Bank of England target. The rates fed in are real rates, so the balances come out in real terms. At 2% inflation, 0.8% real is roughly 2.8% nominal and 5% real is roughly 7% nominal.
The saver here starts with £5,000 and adds £300 a month. Nothing else about them changes across the rows.
| Real return | After 10 years | After 20 years | After 30 years |
|---|---|---|---|
| Cash, 2004 to 2024 outcome (2.6% below inflation) | £35,603 | £59,215 | £77,433 |
| Cash exactly matching inflation (0% real) | £41,000 | £77,000 | £113,000 |
| Cash, long-run average (0.8% real) | £42,875 | £83,892 | £128,311 |
| Mixed portfolio (3% real) | £48,554 | £107,087 | £185,750 |
| Equities, long-run (5% real) | £54,453 | £135,008 | £266,222 |
| Total paid in | £41,000 | £77,000 | £113,000 |
The row worth staring at is the first one. Over the last twenty years, on Barclays' own cash comparator, a saver putting in £77,000 would have ended with £59,215 of purchasing power. Cash did not grow slowly. It shrank.
At the long-run rates, the gap between cash and equities is £11,578 after ten years, £51,116 after twenty, and £137,911 after thirty. It takes 29 years before the invested balance is worth twice the cash balance. That slowness is the whole behavioural problem. At the point where the decision is being made, the difference over the next few years is small enough to feel like noise, which the compound interest calculator shows better than any paragraph can.
The same arithmetic on a pot nobody is adding to
That table assumes someone still paying in. Just under half of ISA holders are not. So run it the other way. Take the average adult ISA of £34,044, add nothing more to it, and leave it alone for twenty years.
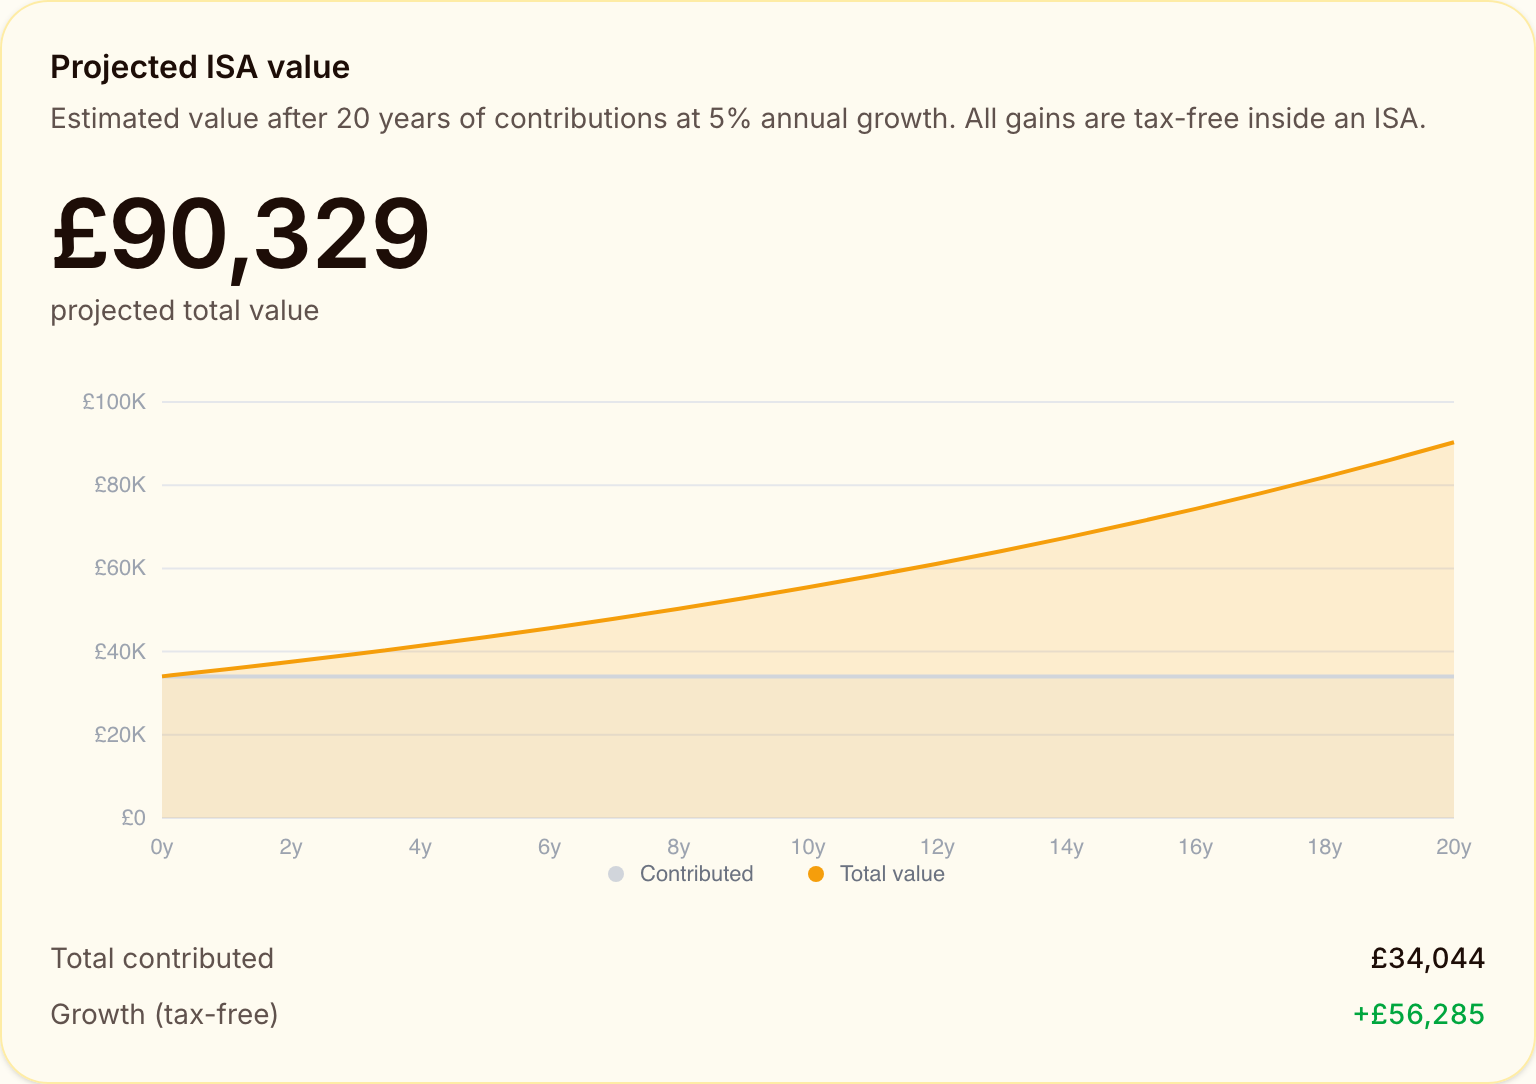
At a 5% real return the pot reaches £90,329 in today's money. Nothing else went in. The £56,285 of growth came from money that was already sitting in the wrapper, and none of it was taxed. That is the ISA doing the job it was built for.
Now the same pot at the long-run cash return.
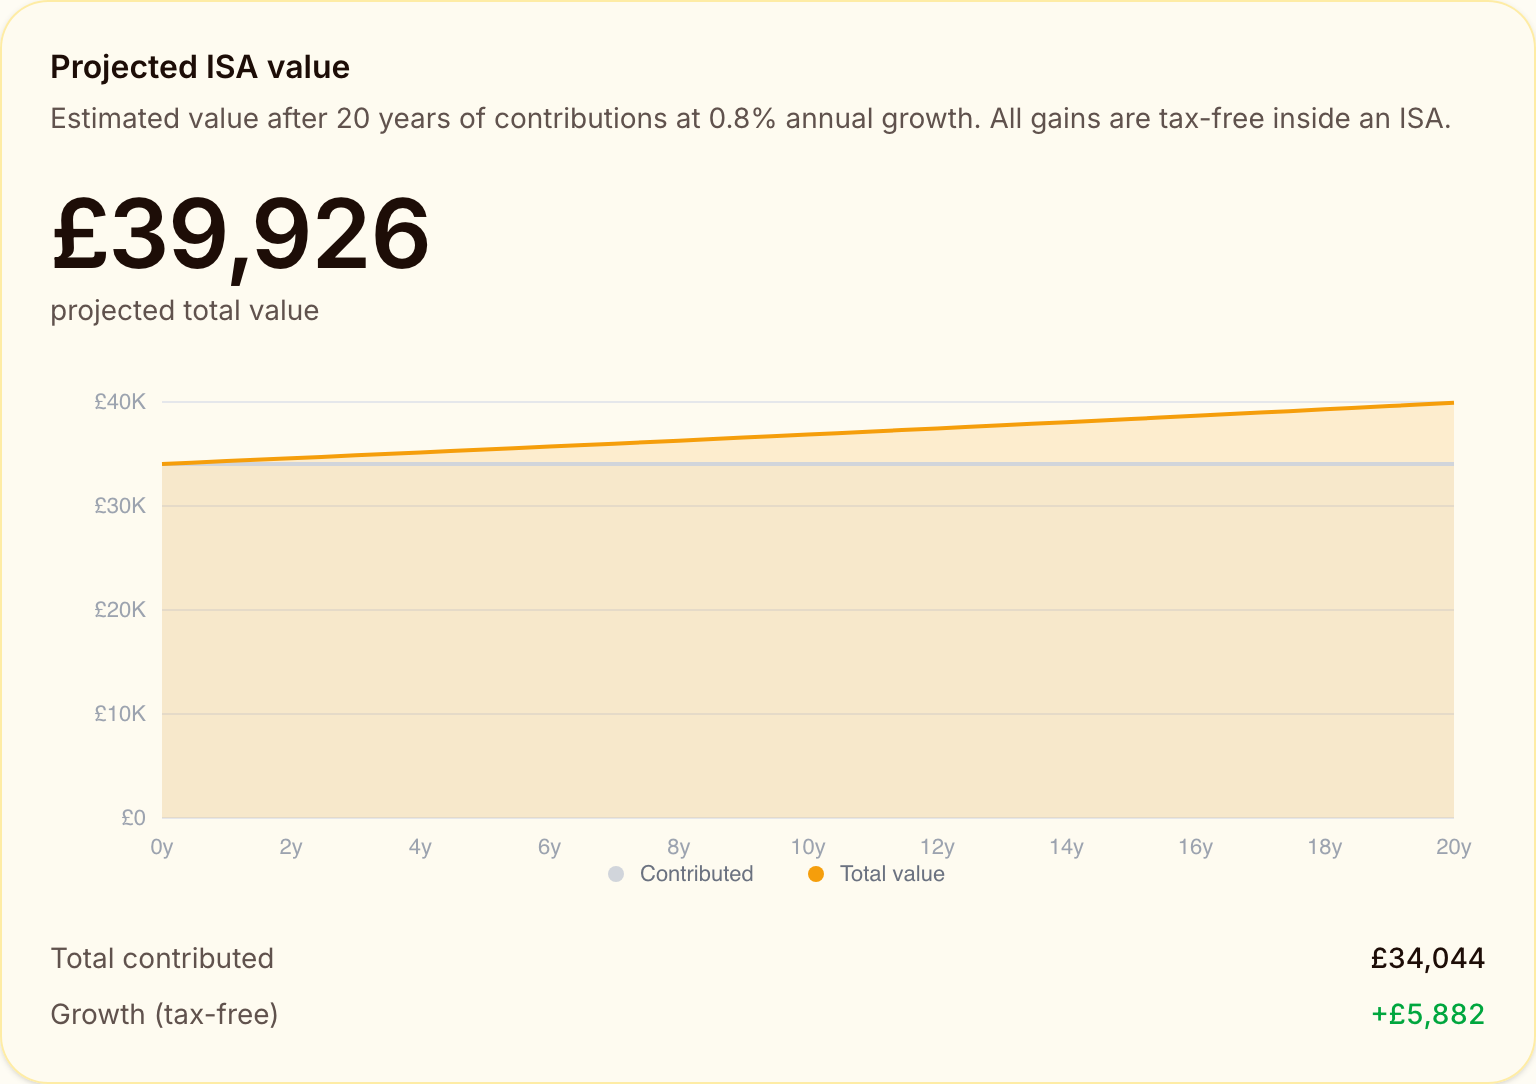
At 0.8% real the same £34,044 becomes £39,926, a gain of £5,882 across two decades. Same wrapper, same opening balance, same twenty years, nothing paid in on either side. The only thing that differs is what the money was held in, and it accounts for £50,403 of the outcome.
Fees, and why the equity row is not 5.1%
The table uses 5% rather than the study's 5.1%, which is a small allowance for costs. In practice a global tracker fund inside a stocks and shares ISA on a mainstream platform costs somewhere between 0.2% and 0.5% a year all in. That is the platform charge and the fund's ongoing charges figure added together. On a £100,000 balance it comes to £200 to £500 a year. The figure sounds trivial and is not, because it comes out of the compounding every year for as long as you hold it.
Cash has no visible fee, which is part of why it feels safe. Its cost is the return it does not pay, and that has run a long way above any platform charge.
11. How households in France, Germany, Sweden and America invest
The balance-sheet table earlier showed what each country's households own. This chapter is about why. The differences are built mostly by policy rather than by national temperament.
France
French households hold 29.1% of financial assets in deposits and only 9.9% in listed shares and investment funds combined. But look at the insurance and pensions column, at 31.3%. Life insurance alone accounts for 26.5% of French household financial assets. That is assurance-vie, a life-insurance contract holding funds that has been the default French investment wrapper for decades. After eight years it gives a reduced income-tax rate on gains and an annual tax-free allowance. It also sits at the centre of French inheritance planning.
The catch is what is inside it. A large share of assurance-vie money sits in fonds en euros, capital-guaranteed funds invested mostly in government and corporate bonds. So a French household that has "invested" through assurance-vie often owns bonds with a guarantee, not equities. France has two other staples. The Livret A is a state-regulated tax-free savings passbook, capped at €22,950 with a government-set rate, and most of the population holds one. The PEA, or Plan d'Épargne en Actions, is an equity plan capped at €150,000 of contributions. It needs five years before its income-tax break applies, and it still charges social levies on the gain. Around 13% of French adults hold one.
Germany
Germany holds the highest deposit share of any large European economy at 36.4%. It also holds a much healthier 14.5% in investment funds, well above the UK's 4.8%. German fund savings plans, the Sparplan, have become genuinely mainstream. Monthly direct-debit investing into exchange-traded funds has spread fast over the last decade. Germany's problem is not that nobody invests. Its pension system is dominated by pay-as-you-go state provision, so very little asset accumulation happens in the background.
Sweden
Sweden is the country everyone points at, and for good reason. Households hold 12.4% of financial assets in deposits, a third of the UK's share. Two policies did most of the work.
The first is the Investeringssparkonto, or ISK, introduced in 2012. Instead of taxing gains and dividends, it applies a small flat annual charge based on the account value, calculated automatically by the bank. There is no capital gains tax return to file and no cost basis to track. That strips out the paperwork that keeps a lot of people away from investing. Nearly half the Swedish adult population holds one.
The second is the Premium Pension System, where 2.5% of every salary is invested in funds the worker chooses. That gives almost the entire working population a live investment account and a reason to learn what a fund is. Sweden also teaches personal finance in schools from the first year. A 2025 study by the European Savings Institute for France's asset management association puts total Swedish household equity exposure, direct and indirect, at 51% of financial assets. France sits at 19% and the euro area as a whole at 21%.
The United States
American households hold 10.4% in deposits and 45.6% in directly held shares and funds. Two structures produce that. The 401(k) and the individual retirement account push tens of millions of ordinary earners into equity funds, usually with automatic enrolment and a target-date default. Brokerage accounts are also culturally ordinary in a way they simply are not in the UK. Gallup's 2025 poll had 62% of adults reporting stock ownership.
One caveat belongs alongside that. The American household portfolio has been flattered by the best-performing large equity market in the world over the period being measured. A structurally identical American household in 1999 would have looked considerably less clever for the following decade.
And the UK
Britain has, on paper, the best retail wrapper of any of them. The ISA has no lifetime cap, no lock-in, no minimum holding period, no tax on withdrawal at any age, and no reporting requirement. A Swedish ISK still charges an annual levy. A French PEA needs five years and still pays social charges. An American 401(k) taxes withdrawals as income and penalises early access. The ISA does none of this.
And 62.8% of the people who hold one own no shares in it.
12. Whether the French would really be richer if they invested like Americans
The claim gets repeated a lot. If French households allocated their savings the way American households do, the argument runs, they would be far wealthier. It contains a real insight and two significant errors.
What is right about it
The allocation difference is genuine and large. France holds 29.1% of household financial assets in deposits against America's 10.4%, and 9.9% in directly held shares and funds against America's 45.6%. Over long periods equities have beaten deposits by several percentage points a year in every developed market. Compounded across a working life, that is the difference between two quite different retirements.
The European Commission has effectively made the same argument at policy level. The Draghi report on European competitiveness, published in September 2024, identified around €11 trillion of EU household money sitting in cash and bank deposits. Europe's failure to channel it into productive investment, it argued, is both a household wealth problem and a growth problem. The resulting Savings and Investments Union work is a direct attempt to build European versions of the ISK and the ISA.
What is wrong about it, first error
The comparison assumes, without saying so, that the French household needs the same amount of private wealth as the American one. It does not.
The OECD's Pensions at a Glance 2025 puts the net pension replacement rate for an average earner at 70% in France against 54% in the UK and an OECD average of 63%. A French worker retiring on an average wage keeps a far larger share of their working income automatically. Compulsory contributions across their career pay for it. The private pot needed to reach the same standard of living is correspondingly smaller.
So some of the French preference for deposits is not a mistake. It is a rational response to needing less private wealth and wanting more of it liquid. The French household has already been made to save a great deal through the payroll. It just never appears on the household's own balance sheet, because a pay-as-you-go pension is a claim on future taxpayers rather than an asset.
What is wrong about it, second error
The claim runs the tape forward from a period where American equities were exceptional and treats that as the baseline. Between 2004 and 2024, on Barclays' figures, a UK 60/40 portfolio returned about 1.0% a year in real terms. A saver in Paris or Manchester who had invested in their domestic market over that period would have beaten cash, but not by the margin the American comparison implies. The gap in that specific window is as much about which market you owned as about whether you invested at all.
The version of the claim that survives scrutiny is narrower and more useful. Households in France, Germany, Italy and the UK hold more of their financial wealth in deposits than any plausible horizon justifies. The cost of that is real, and it compounds. Whether the counterfactual makes them "a lot richer" depends on which market, which decades, and what their state pension was doing in the background.
What this means for a British reader
The UK sits in an awkward middle position. It has France's cash habit and America's thin state pension. The full new state pension is £241.30 a week in 2026/27, about £12,548 a year, after 35 qualifying National Insurance (NI) years. The Pensions and Lifetime Savings Association (PLSA), now trading as Pensions UK, puts a moderate single retirement at £32,700 a year. That gap has to come from somewhere. For most people it comes from a workplace pension, whose auto-enrolment minimum is 8% of qualifying earnings, the slice of pay between £6,240 and £50,270.
That is the specific reason the cash question matters more in Britain than in France. A French saver holding deposits has a large mandatory pension underneath them. A British saver holding deposits has £12,548 a year and whatever auto-enrolment has accumulated in the background, which the pension calculator will put a number on.
13. Why so many people keep money in cash when they know the arithmetic
The FCA asked exactly the right question of exactly the right group. It took UK adults with £10,000 or more in cash savings, no investments and no regulated advice in the previous year. Then it asked them why.
The first finding is that most of them have not considered it. 54% said they had not really thought about investing, or had not thought about it at all. Among those unwilling to take any investment risk, the figure was 70%.
The second finding is the one that reframes the whole debate. Respondents were asked whether they agreed with the statement that cash ISAs and stocks and shares ISAs had performed about the same, on average, over the past ten years. Only 16% correctly disagreed. Some 19% agreed, and 36% said they did not know. Among those with £50,000 or more in cash, the share who got it right rose to 25%. That still leaves three-quarters of the group either wrong or unsure.
Read that again. Three-quarters of the people with five-figure cash balances and no investments either believe cash has matched investments over the last decade or have no idea. This is not a story about risk appetite. It is a story about information.
Awareness of the more basic point is better but going backwards. Asked whether money in cash savings decreases in value because interest usually does not keep pace with inflation, 59% correctly agreed in 2024, down from 67% in 2022.
What people say when asked directly
| Reason for not investing | Share giving it |
|---|---|
| I worry about losing money | 34% |
| I am happy with the interest I receive on my savings | 29% |
| Do not know enough, need support, or feel overwhelmed (combined) | 29% |
| I do not know enough about investments | 24% |
| My financial affairs are straightforward, I do not need to invest | 21% |
| I do not have enough money to consider investing | 17% |
| I have not had the time or got round to it yet | 15% |
| I feel overwhelmed by the number of options available | 12% |
| I would like to, but I need support to make the decisions | 8% |
Two of those answers do the heavy lifting. The worry about losing money is the largest single reason. Barclays found that among non-investors who see investing as too risky, two-thirds equated investment risk with losing most or all of their savings. That is not a considered assessment of volatility. It is a category error about what a diversified fund does.
The second is "I am happy with the interest I receive on my savings", at 29%. That is a perfectly reasonable answer if you believe cash and investments have performed similarly, which most of this group does.
The trend is going the wrong way
The share of UK adults with £10,000 or more in investible assets holding all or at least three-quarters of it in cash has risen steadily.
| Investible assets held | All or mostly in cash, 2020 | 2022 | 2024 |
|---|---|---|---|
| £10,000 or more (all) | 55% | 58% | 61% |
| £10,000 to under £20,000 | 79% | 79% | 79% |
| £20,000 to under £50,000 | 66% | 71% | 71% |
| £50,000 to under £100,000 | 59% | 61% | 66% |
| £100,000 to under £250,000 | 34% | 40% | 47% |
| £250,000 or more | 15% | 19% | 23% |
Every single band has moved towards cash since 2020, including the £250,000-and-over group. The overall share of UK adults holding any investment fell from 37% in 2022 to 35% in 2024.
Some of that is the interest-rate cycle doing what interest-rate cycles do. Bank Rate went from 0.1% to 5.25% across that period, and cash suddenly paid something. That is a rational reason to hold more of it. The question is whether the money comes back out when rates fall. ISA subscription data suggests it does not move quickly.
14. What changes in April 2027 and April 2028
Two dated changes are already in motion, and both push in the same direction.
The cash ISA limit falls on 6 April 2027
At the Autumn Budget 2025 the government announced a reform of the ISA, set out in HMRC's ISA reform 2027 factsheet. Here is what changes on 6 April 2027.
| Rule | Now (2026/27) | From 6 April 2027 |
|---|---|---|
| Overall ISA allowance | £20,000 | £20,000, unchanged |
| Maximum into a cash ISA, under 65 | £20,000 | £12,000 |
| Maximum into a cash ISA, 65 and over | £20,000 | £20,000, unchanged |
| Tax on cash interest inside a stocks and shares ISA | None | 22% charge, paid by the ISA manager to HMRC |
| Transfer from a stocks and shares ISA to a cash ISA, under 65 | Allowed | Blocked |
| Transfer from a cash ISA to a stocks and shares ISA | Allowed | Allowed |
The higher cash limit applies from the start of the tax year in which someone turns 65, and transfer flexibility returns at the same point. Money market funds are the only asset the rules define as cash-like. A portfolio made entirely of them will no longer be eligible inside a stocks and shares ISA, though partial allocations remain allowed.
There is nothing subtle about the intent. The government wants the remaining £8,000 of the allowance to go into investments. It has closed the two obvious ways round.
The Lifetime ISA is replaced from April 2028
Covered earlier in this guide. The First-Time Buyer ISA was consulted on in mid-2026 and is due in April 2028. It removes the withdrawal charge, drops the age-40 entry limit and pays the bonus at completion. Eligibility narrows to first-time buyers with a mortgage, and the retirement option goes. Existing Lifetime ISA holders keep their accounts on the current rules.
The pension change already scheduled for April 2027
Not an ISA change, but it belongs in any forward-looking view of where UK savings are going. From 6 April 2027, most unused pension funds and death benefits come within the estate for inheritance tax purposes, as set out in HMRC's policy paper. For roughly a decade the standard planning position was to spend other assets first and preserve the pension to pass on free of inheritance tax. That reverses. Anyone whose plan relies on the old treatment has a dated reason to look at it again.
What this adds up to
Taken together, the direction of travel is a state trying to move retail money out of deposits and into markets. It is using the allowance structure rather than a public campaign. Whether that works is an open question. The evidence in this guide suggests the size of the cash allowance is not the binding constraint. Only 22.7% of subscribers use the full £20,000, and 41.9% put in under £2,500. What binds is that most savers do not know cash has underperformed, and a lower cash limit does not tell them.
15. Worked example: saving in a cash ISA
One saver, followed through two chapters. Everything about them is held constant except the return they earn, so the comparison comes down to that single dial and nothing else.
| Input | Value | Why this value |
|---|---|---|
| Opening ISA balance | £5,000 | Below the £14,948 average for cash-only holders, which is the realistic starting point for someone in their thirties |
| Monthly contribution | £300 | £3,600 a year, close to the £2,500-to-£5,000 band that 41.9% of ISA subscribers sit in or below |
| Horizon | 20 years | Long enough for compounding to matter, short enough to be a real plan rather than a lifetime |
| Inflation assumption | 2% | The Bank of England target, so every figure below is in today's money |
| Real return on cash | 0.8% | The Barclays Equity Gilt Study long-run average since 1899, which also matches Bank Rate at 3.75% against consumer price inflation of 2.9% in the year to July 2026 |
Those choices need justifying, because each of them shades the result.
The £300 a month is deliberately modest. It is not the sort of figure that only works for a high earner, and it sits well below the point where the £20,000 allowance starts to bind. The £5,000 opening balance sits under the cash-only average on purpose. Averages in this data are pulled up hard by a minority of large balances, so starting at the average would overstate where most people begin.
The 0.8% real return is the number most likely to be argued with, so it is worth being explicit. It is the long-run UK cash figure from 1899 to 2025. It is also almost exactly what a saver is getting today. The Bank of England maintained Bank Rate at 3.75% on 30 July 2026, and consumer price inflation ran at 2.9% in the year to July 2026. Over the last twenty years, though, Barclays' cash proxy did far worse, losing 40.5% of its real value, or about 2.6% a year. Using 0.8% rather than a negative figure is the generous assumption for cash, not the harsh one.
What the cash saver ends up with
After 20 years the saver has paid in £77,000 and holds £83,892 in today's money. The wrapper has done its job, in that none of the interest was taxed. That account has grown by £6,892 in real terms across two decades, which is about 9% on everything paid in.
That is what a cash ISA delivers when it works exactly as intended and the interest rate cooperates. The money is there and reachable any day of the week. It is protected up to £120,000 per person per firm by the Financial Services Compensation Scheme, and it buys slightly more at the end than it would have at the start.
Run the same saver over other horizons and the picture is consistent rather than dramatic.
| Horizon | Paid in | Cash balance at 0.8% real | Real gain |
|---|---|---|---|
| 10 years | £41,000 | £42,875 | £1,875 |
| 20 years | £77,000 | £83,892 | £6,892 |
| 30 years | £113,000 | £128,311 | £15,311 |
16. Worked example: the same saver, invested
Same person. Same £5,000 opening balance, same £300 a month, same 20 years, same 2% inflation assumption. One dial moves.
| Input | Cash version | Invested version |
|---|---|---|
| Opening ISA balance | £5,000 | £5,000 |
| Monthly contribution | £300 | £300 |
| Horizon | 20 years | 20 years |
| Inflation assumption | 2% | 2% |
| Real return | 0.8% | 5.0% |
The 5% real return is the Barclays long-run UK equity figure of 5.1% with a small deduction for costs. A global tracker fund held in a stocks and shares ISA on a mainstream platform typically costs 0.2% to 0.5% a year, once the platform charge and the fund's ongoing charges are combined. So 5% is roughly the long-run figure net of a competitive fee. Nothing here is a forecast. It is a historical average applied forward, and the real path would look nothing like a smooth line.
What the invested saver ends up with
After 20 years the same saver has paid in £77,000 and holds £135,008 in today's money. The gap against the cash version is £51,116. That is 66% of everything they paid in over the two decades.
The full grid
Three dials, every combination, all in today's money. The saver and the opening £5,000 are the same in every cell.
| Monthly | Years | Cash, 2004-2024 outcome | Cash at inflation | Cash, long-run | Mixed, 3% real | Equities, 5% real |
|---|---|---|---|---|---|---|
| £150 | 10 | £19,730 | £23,000 | £24,145 | £27,637 | £31,299 |
| £150 | 20 | £31,096 | £41,000 | £44,878 | £58,059 | £74,137 |
| £150 | 30 | £39,865 | £59,000 | £67,331 | £98,943 | £143,916 |
| £300 | 10 | £35,603 | £41,000 | £42,875 | £48,554 | £54,453 |
| £300 | 20 | £59,215 | £77,000 | £83,892 | £107,087 | £135,008 |
| £300 | 30 | £77,433 | £113,000 | £128,311 | £185,750 | £266,222 |
| £500 | 10 | £56,766 | £65,000 | £67,849 | £76,444 | £85,326 |
| £500 | 20 | £96,707 | £125,000 | £135,911 | £172,458 | £216,169 |
| £500 | 30 | £127,524 | £185,000 | £209,619 | £301,493 | £429,298 |
Contribution is the stronger dial at every horizon in this grid. What changes is the margin. At ten years, moving £150 a month from cash to equities lifts the balance by about a third, from £24,145 to £31,299, while tripling the contribution to £500 nearly triples it. At thirty years the switch to equities more than doubles the balance on its own, from £67,331 to £143,916, and tripling the contribution no longer runs away with it.
Watch what that does to a pairing. The £300-a-month investor and the £500-a-month cash saver finish twenty years within £1,000 of each other, at £135,008 and £135,911. By thirty years the investor is more than £56,000 ahead. So the reading is not that return beats contribution. It is that a smaller contribution invested catches a larger one held in cash, and roughly two decades is where it happens.
The realistic middle case
The grid maps the corners. Here is the row a reader is most likely to be facing, using rates available now rather than long-run averages.
| Assumption | Value | Source |
|---|---|---|
| Cash return, nominal | 3.75% | Bank Rate, held by the Bank of England on 30 July 2026, as the anchor for a competitive easy-access cash ISA |
| Inflation | 2.9% | Consumer price inflation in the year to July 2026 |
| Cash return, real | 0.8% | The two above, netted |
| Investment return, real | 5.0% | Barclays long-run UK equity figure less a competitive platform and fund fee |
| Result after 20 years, £300 a month | £83,892 cash against £135,008 invested | Computed |
Two biases in that middle case run in opposite directions and are worth naming. Holding inflation at 2.9% for twenty years is pessimistic against cash, set against the Bank's 2% target, because a return to target would lift the real cash return. Applying a UK long-run equity average forward is optimistic against investing, set against the last twenty years, when a UK 60/40 portfolio returned about 1.0% a year real. Neither correction is large enough to change the ordering at twenty years. A reader who thinks either assumption is wrong can see which cell of the grid to read instead.
What the projection does not capture
The table shows a smooth line and the reality is not one. A portfolio returning 5% a year on average will spend individual years down 20% or more. The twenty-year figure only reaches someone who does not sell during those years. FCA data suggests that is the real constraint. Among adults with £5,000 or more in investments, only 12% expected to withdraw a significant portion within three years, against 25% of those with £5,000 or more in cash savings. People who invest already tend to hold for longer, and that is part of why their outcomes look better.
17. How to decide what any of this means for you
The first answer is the practical one. Put your own details into a thorough, UK-specific financial calculator and work out your actual position. Every household differs on the things that matter most here. Your horizon, your tax band, your existing pension, your mortgage, whether you have children, whether you are planning to buy. National averages cannot answer a question about you. Get started with A Few Quid takes about ten minutes, and it produces a projection you can interrogate rather than a number you have to trust.
If you would rather work through it yourself, these are the questions that decide it, roughly in the order they bind.
Three things worth doing this week regardless
None of these require a decision about investing.
The first is to check the rate on any cash you hold. Providers rely on old accounts going unwatched, and the gap between a competitive easy-access rate and a legacy one is routinely more than a percentage point. On £20,000 that is £200 a year for one afternoon of admin.
The second is to check whether any stocks and shares ISA you hold contains uninvested cash. Nationally, £20.2 billion was sitting in exactly that position at 5 April 2024. From April 2027 the interest on it also picks up a 22% charge.
The third is to look at what your workplace pension is invested in. It is the largest financial asset most British households own after the house, and it is almost certainly holding equities. The number of people who have never opened the statement is large.
What this guide has not told you
It has not told you what to do with your money, and it deliberately has not tried. The data here supports a narrow set of claims. Roughly a quarter of UK adults have no buffer. British households hold an unusually high share of their financial wealth in deposits by international standards. Most ISA holders own no shares in the wrapper. Cash has underperformed investments over long periods, and most people holding cash do not know that. Those are facts about a country, not conclusions about you.
The bridge between the two is your own numbers. That is the part nobody else can do for you.
About the author and this calculator
A Few Quid was built by Mike Gallagher, who got tired of personal finance advice that stopped at rules of thumb. The rules of thumb in this area are unusually bad. Save 20%, hold three months of expenses, keep your age in bonds, use your ISA allowance. Every one of them is an average of situations that have almost nothing in common. The data in this guide shows how wide that spread runs. Two households on the same salary can face completely different answers depending on their horizon, their pension, their mortgage and how much of a fall they could actually sit through.
So the app models your household rather than a representative one. It runs your salary, pension, savings, mortgage and spending forward year by year in today's money. Change one assumption at a time and you can watch what it does. It is a calculator, not an adviser. Mike is not a financial adviser, and A Few Quid is not authorised by the Financial Conduct Authority. Nothing it produces is a personal recommendation, and nothing in this article is either.
Treat every number in this guide the same way. The HMRC and Eurostat and Federal Reserve figures are facts about populations. The projections are arithmetic applied to assumptions, and the assumptions are the part worth arguing about. Change the return, change the horizon, change the contribution, and watch which one actually moves your answer. That is the only version of this exercise that tells you anything about your own money.
FAQ
How many people in the UK live paycheck to paycheck?
There is no single official figure, because the phrase has no official definition. The closest hard measures are these. In May 2026, 25% of adults in Great Britain said their household could not pay an unexpected but necessary expense of £850, and 35% expected to be unable to save anything over the following year, according to the Office for National Statistics. The Financial Conduct Authority's Financial Lives survey found 13.1 million adults, 24% of the UK, had low financial resilience in May 2024, and 29% had no investible assets or under £1,000. Roughly a quarter to a third of UK adults are living without a usable buffer, depending on where the line is drawn.
Do more Americans or more Britons live paycheck to paycheck?
It depends entirely on the measure. Self-reported American surveys put the figure around 65%, but those ask people to judge themselves against an undefined phrase. When Bank of America Institute measured it from actual account data, defining it as necessity spending above 95% of income, the answer for 2025 was nearly 24% of US households. That is very close to the UK's 24% low-financial-resilience figure and the 25% who could not meet an £850 bill. On the comparable measures the two countries look similar. Where they diverge sharply is what happens to the money above the buffer.
How many people in the UK have an ISA?
About 21.3 million adults held an Individual Savings Account in 2022/23, the latest year HMRC breaks down by holder. Around 15 million adult accounts received a subscription during 2023/24, the highest for 13 years. But 10.4 million holders, roughly half, put nothing in at all that year, and 8.3 million holders had under £2,500 in the wrapper.
Do more people have a cash ISA or a stocks and shares ISA?
Cash, by a wide margin. Of 21.3 million ISA holders in 2022/23, 13.4 million held only cash, 4.4 million held only stocks and shares, and 3.6 million held both. So 62.8% of ISA holders had no stock market exposure through the wrapper at all. The pattern only reverses at high incomes. Below £50,000 of income there are three to four cash-only holders for every stocks-and-shares-only holder, and the ratio does not fall below one until the £100,000 to £149,999 band.
Is the Lifetime ISA only used for buying a house?
That is what it was designed for, and it does get used that way, but it also penalises a lot of people. Between 2018/19 and 2024/25, 314,600 account holders withdrew to buy a first home, while 415,750 made unauthorised withdrawals and paid £315 million in withdrawal charges between them. In 2024/25 alone there were 1.48 penalised withdrawals for every first-home purchase. The Lifetime ISA is being replaced by a First-Time Buyer ISA from April 2028, with no penalty and no retirement option.
Why do British households hold so much of their money in cash?
Partly habit, partly a knowledge gap, partly the shape of the tax system. UK households held 34.7% of their financial assets in currency and deposits at the end of 2025, against 10.4% in the United States and 29.1% in France, on OECD figures. The Financial Conduct Authority found that only 16% of adults with £10,000 or more in cash and no investments correctly disagreed that cash ISAs and stocks and shares ISAs had performed about the same over the previous ten years. More than half had never really thought about investing at all.
Would the French be richer if they invested like Americans?
On the historical numbers, yes, though the comparison flatters the American side. French households hold 29.1% of financial assets in deposits and only 9.9% in listed shares and investment funds combined, against 45.6% in the US. Over the very long run, UK equities returned 5.1% a year after inflation against 0.8% for cash on Barclays figures, and US equities did better still. But France pays for its lower risk-taking with a state pension that replaces about 70% of an average earner's income against the UK's 54%, so a French saver genuinely needs a smaller private pot. The comparison also runs one way through a period when American equities were the best-performing large market in the world, which is a fact about the past.
What is changing about ISAs in April 2027?
From 6 April 2027 the amount you can put into a cash ISA in a year falls to £12,000 for anyone under 65, though the overall ISA allowance stays at £20,000, so the remaining £8,000 has to go into a stocks and shares or innovative finance ISA. Savers aged 65 and over keep the full £20,000 cash limit. Interest earned on cash held inside a stocks and shares ISA will carry a 22% charge, paid by the ISA manager to HMRC, and transfers from a stocks and shares ISA into a cash ISA will be blocked for the under-65s.
Glossary
- ISA (Individual Savings Account)
- A UK tax wrapper introduced on 6 April 1999 to replace Personal Equity Plans and Tax-Exempt Special Savings Accounts. Growth, dividends, interest and withdrawals are all free of UK tax. The annual subscription allowance is £20,000 in 2026/27, across all ISA types combined.
- Cash ISA
- An ISA holding deposits rather than investments, paying interest set by the provider. It held £360 billion at 5 April 2024, 41.3% of all adult ISA money, and 13.4 million adults held nothing else. From 6 April 2027 the annual cash ISA limit falls to £12,000 for the under-65s.
- Stocks and shares ISA
- An ISA holding investments such as shares, funds and investment trusts. It held £511 billion at 5 April 2024, 58.6% of all adult ISA money, spread across far fewer people than the cash version. Around 4.1 million accounts received a subscription in 2023/24.
- Lifetime ISA (LISA)
- An ISA opened between 18 and 39, taking up to £4,000 a year until 50, with a 25% government bonus of up to £1,000 a year. The money can be used to buy a first home worth up to £450,000, or drawn from age 60. Any other withdrawal carries a 25% charge. It is being replaced by a First-Time Buyer ISA from April 2028.
- Low financial resilience
- The Financial Conduct Authority's measure, met if a person has missed payments on bills or credit in three or more of the past six months, feels heavily burdened by their commitments, or has very limited savings. 13.1 million UK adults, 24%, met it in May 2024.
- EU-SILC
- European Union Statistics on Income and Living Conditions, the survey behind Eurostat's cross-country comparisons of income and financial strain. Its unexpected-expense question sets a national threshold based on the at-risk-of-poverty line. The UK stopped reporting to it after 2018.
- Real return
- The return on money after inflation has been taken out, which is what actually determines whether savings buy more later than they do now. A cash account paying 4% while prices rise 2.9% is earning roughly 1% real. Every projection in this guide is stated in real terms, meaning today's money.
- Household financial assets
- Everything a household owns in financial form, which means deposits, shares, investment funds, bonds, life insurance and pension entitlements, but not the house itself. UK households held £6.75 trillion of them at the end of 2025 on OECD figures.
- Financial resilience
- The capacity to absorb an income shock or an unexpected cost without falling into arrears or borrowing. It is usually measured by whether a household can meet a set expense from its own resources, or by how many months of spending its savings would cover.
- PLSA (Pensions and Lifetime Savings Association)
- The trade body, now trading as Pensions UK, that publishes the Retirement Living Standards. These set out what minimum, moderate and comfortable retirements cost in the UK each year, and are widely used as retirement income benchmarks.
- Auto-enrolment
- The rule requiring employers to enrol eligible workers into a workplace pension unless they opt out. The minimum total contribution is 8% of qualifying earnings, the slice of pay between £6,240 and £50,270, made up of at least 3% from the employer.
- FCA (Financial Conduct Authority)
- The UK's conduct regulator for financial services. Its Financial Lives survey, run every two years with around 18,000 interviews, is the most authoritative picture of UK household finances outside the official statistics.
- ONS (Office for National Statistics)
- The UK's national statistics agency. Its Opinions and Lifestyle Survey tracks the share of adults who could not meet an unexpected £850 expense, among other measures of household financial pressure.
Sources
- Annual savings statistics 2025 — HM Revenue and Customs
- Commentary for Annual savings statistics: September 2025 — HMRC
- Individual Savings Accounts (ISAs) — GOV.UK
- Lifetime ISA — GOV.UK
- ISA reform 2027: anti-circumvention rules factsheet — GOV.UK
- First Time Buyer ISA consultation — GOV.UK
- Income Tax rates and Personal Allowances — GOV.UK
- The new State Pension: what you'll get — GOV.UK
- Financial Lives 2024 survey: key findings — Financial Conduct Authority
- Financial Lives 2024 survey: consumer investments — Financial Conduct Authority
- Public opinions and social trends, Great Britain: May 2026 — Office for National Statistics
- Total wealth in Great Britain — Office for National Statistics
- Inability to face unexpected financial expenses (ilc_mdes04) — Eurostat
- Quarterly financial balance sheets, non-consolidated (dataset DSD_NASEC20@DF_T720R_Q) — OECD Data Explorer
- Financial Accounts of the United States, Z.1, first quarter 2026 — Federal Reserve
- Report on the Economic Well-Being of U.S. Households in 2025 — Federal Reserve
- Paycheck to paycheck: slowing but growing (10 November 2025) — Bank of America Institute
- What percentage of Americans own stock? — Gallup
- Households' long-term savings and stock market participation in Europe (2025) — OEE for the AFG
- The missed opportunity of not investing (9 April 2026) — Barclays
- The future of European competitiveness (the Draghi report) — European Commission
- Pensions at a Glance 2025, net pension replacement rates — OECD
- Consumer price inflation, UK — Office for National Statistics
- Interest rates and Bank Rate — Bank of England
- Workplace pension participation and savings trends of employees: 2009 to 2025 — Department for Work and Pensions
- Deposit protection limit rises to £120,000 from 1 December 2025 — Financial Services Compensation Scheme
- Retirement Living Standards — Pensions UK (PLSA)
Related reading
- Investing and retiring in the UK vs France — Tax, property and pensions compared across the Channel.
- What percentage of your salary to save for retirement — The UK numbers behind the rules of thumb, by age and starting point.