Rent vs Buy in the UK: When Buying Wins, When Renting Wins, and How to Tell
Whether renting or buying builds more wealth in the UK depends on rates, how often you move, and what your deposit could earn. Model the break-even.
A long-read planning briefing, roughly an hour
A Few Quid is not authorised or regulated by the FCA. This article is general information, not advice.
In the twelve months to March 2026 the average UK house price went precisely nowhere. Zero per cent growth, says the Office for National Statistics (ONS), while average private rents rose 3.5% to £1,381 a month and the typical two-year fixed mortgage still cost over 5.5%. Twenty years ago the same question, rent or buy, had an easy answer, because prices were doubling every decade and a mortgage cost less than the rent on the flat next door. Today every part of that picture has changed, and the answer has changed with it. Sometimes to "buy as soon as you can", sometimes to "renting is making you richer, keep going", and most often to "it depends on four numbers nobody has told you to check".
This guide is about those numbers. Not a tribal argument for property, and not a contrarian case for renting forever, but the actual machinery of the comparison. What buying really costs up front and every year after. What renting really costs, including the costs that are not money. How the mortgage rate, the rental yield, your investment returns inside an Individual Savings Account (ISA), and the simple question of how often you move each push the answer one way or the other. Where buy-to-let fits, and mostly does not. And how to run the whole thing on your own figures rather than trusting a stranger's spreadsheet, mine included.
A Few Quid is not authorised by the Financial Conduct Authority (FCA). This article is general information, not advice. Nothing here is a personal recommendation. For decisions about mortgages, property purchase, or investments, speak to a regulated financial adviser who can look at your full situation.
How to read this guide
This is a long read, so here is the route before you set off.
We start with the question itself, because most rent-or-buy arguments are really two people comparing different things. Framing it properly, as unrecoverable costs on both sides, settles half the fights before they start.
Then come the costs. The upfront bill for buying, where stamp duty, deposits and fees live. The running bill for owning, which is where the "your home is also a liability" idea earns its keep, from the 1% maintenance rule to service charges. Then the real cost of renting, in money and in security, including what the Renters' Rights Act 2025 changed last month and what it did not.
The middle of the guide is the engine room. Interest rates first, because the gap between the mortgage rate and the rental yield is the single fastest way to read the market you are standing in. Then the opportunity cost of the deposit, where the ISA wrapper, the Lifetime ISA bonus and the arithmetic of leverage all collide. Then the long history, houses against shares across the decades, which is less a verdict than a warning about how much the answer depends on which twenty years you happen to live through.
After that, the situational chapters. Moving frequency, the variable that outranks the market for most people. Schools and catchments, where renting close can beat buying far. Buy-to-let, covered briefly, because the tax rules have rewritten that case since 2016 and most readers weighing rent against buy are not weighing a landlord business. And the things the spreadsheet cannot price, the security, control and identity factors that decide plenty of cases on their own.
Two worked examples then run real numbers through the rent vs buy calculator, in inflation-adjusted terms and on the same person both times, once where buying wins comfortably and once where renting finishes six figures ahead, with only three dials moved between them so you can see exactly which inputs flip the result. A chapter on horizons stretches both examples to 40 and 50 years, where the mortgage-free decades change the picture entirely, and weighs buying early against buying late. A short chapter on deciding pulls the threads together, and the guide closes with a note on who built this and why.
1. What the question is actually asking
Strip the emotion out and "should I rent or buy" is a comparison between two bundles, not two monthly payments.
The renter buys one thing, the use of a home, and pays for it with rent. The buyer purchases two things stapled together, the use of a home and a leveraged investment in a single property, and pays for the bundle with interest, fees, taxes and risk. Almost every bad argument on this topic comes from comparing a rent payment against a mortgage payment as if they were the same kind of object. They are not. Part of the mortgage payment buys the house back from the bank, which is saving, not spending. The rest of it, the interest, is exactly as gone as rent.
So the comparison that actually works runs like this. On the renting side, count the rent. On the buying side, count everything that does not come back, which means the mortgage interest, the maintenance, the buildings insurance, the service charge if there is one, and the purchase and sale costs spread across the years you stay. Then give the renter credit for the one move open to them that the buyer gave up, investing the deposit and the difference whenever renting is cheaper month to month. Whoever ends the period with more total wealth, equity for the buyer, portfolio for the renter, wins that scenario.
Notice the phrase "that scenario". The result is not a law of nature. It is the output of inputs, and the inputs move. That is the entire reason this article keeps pushing you toward running your own numbers rather than memorising anyone's conclusion.
There is one more framing worth fixing before the numbers. A home is simultaneously an asset and a liability. The asset part is obvious, a thing of value that can rise in price and that you can eventually sell or live in rent-free. The liability part is the stream of obligations that comes stapled to it, the repairs you cannot decline, the insurance you must hold, the tax when you buy, the fees when you sell, the interest the lender collects for decades. Owners who only see the asset get blindsided by the liability. Renters who only see the liability never notice the asset compounding on the other side. The whole point of modelling is to hold both in view at once.
2. The upfront cost of buying
Buying a home starts with a cheque so large that its size distorts the rest of the decision. It helps to split it into the part that stays yours, the part the government takes, and the part the professionals take.
The deposit stays yours. It converts directly into equity, so it is not a cost at all, it is a transfer from one pocket to another. What it does cost is opportunity, the returns it would have earned elsewhere, which is the subject of the opportunity-cost chapter. The deposit's size also sets your loan-to-value (LTV), and lenders price mortgages in LTV bands, so a bigger deposit buys a cheaper rate on the whole loan. Moving from 95% to 90% LTV, or from 90% to 85%, routinely knocks a meaningful fraction off the interest rate, which compounds over a five-year fix into thousands.
Stamp duty goes to the government. In England and Northern Ireland, Stamp Duty Land Tax (SDLT) is charged in slices, and these are the bands since they reverted in April 2025.
| Price slice | SDLT rate |
|---|---|
| Up to £125,000 | 0% |
| £125,001 to £250,000 | 2% |
| £250,001 to £925,000 | 5% |
| £925,001 to £1.5m | 10% |
| Above £1.5m | 12% |
A first-time buyer gets relief, paying nothing up to £300,000 and 5% on the portion between £300,001 and £500,000. Cross £500,000 by a single pound and the relief vanishes entirely, with standard rates applying to the whole price, a genuine cliff edge that catches buyers in the South East every week. Scotland charges Land and Buildings Transaction Tax and Wales charges Land Transaction Tax, both with their own bands and their own first-time buyer treatment, so the figures here are England and Northern Ireland only. The Autumn Budget 2025 left all of this untouched, so these are the live numbers for 2026/27. The stamp duty calculator does the slicing for any price and buyer type.
Fees go to the professionals. Conveyancing for a purchase typically runs somewhere between £500 and £1,150 plus disbursements, more for leasehold. A survey costs from around £400 for a basic HomeBuyer report to £1,500 for a full building survey on an older property, and on a purchase this large the survey is the cheapest insurance you will ever decline at your peril. Mortgage arrangement fees of around £1,000 are common on the keenest rates. Removals average around £709 for a short-distance move according to reallymoving, with packing services pushing four figures. None of this is enormous next to the deposit, but none of it comes back, and all of it repeats every time you move, which is the seed of the moving-frequency chapter.
One more upfront consideration belongs here because it changes the saving years before the buying. A first-time buyer saving a deposit inside a Lifetime ISA (LISA) can put in £4,000 a year and receive a 25% government bonus, up to £1,000 a year, on top of any growth. That is an unbeatable boost on the way in, with two sharp edges on the way out.
Add it together for a sense of scale. On a £250,000 first home with a 10% deposit, the buyer hands over £25,000 that remains theirs as equity, £0 in stamp duty thanks to first-time buyer relief, and very roughly £2,000 to £3,500 in fees, surveys and removals that are simply gone. On a £550,000 home for a mover in London, the SDLT alone is £17,500 and the total friction climbs toward £30,000. The first buyer's unrecoverable entry cost is around 1% of the house. The second's is over 5%. Same country, same tax system, completely different decision maths, and we have not touched the mortgage yet.
3. The running cost of owning, or the home as liability
The purchase is a single shock. Ownership is a drip, and the drip is the part almost everyone underestimates, because no one invoices you for it in advance.
Start with maintenance. The standard rule of thumb says to budget around 1% of the property's value per year for upkeep, and UK evidence sits comfortably around it. Research by London agency Benham and Reeves put average annual maintenance spend at £2,699 back in 2021, covering the unglamorous procession of gutters, roof tiles, boilers, pointing and paint. Halifax research the same year found the spend varies sharply by property type, with detached homes near £1,250 a year, terraces around £950 and flats nearer £680, and a Houzz survey found homes over a century old cost nearly double the average for newer stock. The exact figure matters less than the structure of the thing. It is lumpy. Years of nothing, then a roof. The renter never meets any of it, because every one of those bills belongs to the landlord, and a renter's effective maintenance bill is folded into the rent whether the landlord prices it correctly or not.
Then the standing charges. Buildings insurance is compulsory in practice for anyone with a mortgage. Ground rent and, far more painfully, service charges apply to leasehold flats, and they have been running hot. Hamptons' 2025 Service Charge Index put the average for a leasehold flat in England and Wales at £2,405 a year, past £200 a month for the first time and up by about a third in five years. That is a rent-sized cost that arrives on top of the mortgage, does not build a penny of equity, and is set by a management company you did not choose.
Council tax, energy and water fall on both households, so they mostly cancel out of the comparison, though owners of older, larger properties tend to pay more of all three than renters of newer, smaller ones.
The useful mental model is that an owner holds two positions at once. A long position in one specific property's price, and a short position in everything that can go wrong with one specific building. The first position gets all the attention at dinner parties. The second one sends the surprise bills. Neither cancels the other, and a fair comparison against renting carries both.
None of which makes ownership a bad deal. It makes ownership a priced deal. The owner's running costs buy something the renter cannot purchase at any price, which is control. No landlord can serve notice, raise the rent, refuse a dog, or veto a wall colour. Past the final mortgage payment the running costs are all that remain, and a mortgage-free household in later life is the single biggest difference between the retirement maths of owners and renters. The retirement guide works through that gap in detail, and it is large enough that the Pensions and Lifetime Savings Association builds its retirement standards on the assumption of a paid-off home.
4. What renting really costs
The renter's ledger looks shorter, one payment a month, no roofs, no surveys, no stamp duty. The catch is in how that one payment behaves over time, and in the clauses that surround it.
Start with the level. The ONS Price Index of Private Rents put the average UK private rent at £1,381 a month in April 2026, up 3.5% in a year. England averages £1,438, Wales £834, Scotland £1,019, and the regional spread inside England runs from the North East, cheapest in level but fastest in growth at 6.5%, to London, highest in level but slowest in growth at 2%. Against the ONS average house price of £268,000, flat over the same year, the national picture is rents grinding upward while prices tread water, which narrows the rent-vs-buy gap from the renting side.
Growth is the renter's structural problem. A mortgage payment is fixed for the term of each fix and ends entirely when the loan is repaid. Rent never ends and historically rises with wages, which means the renter's housing cost compounds for life, including through retirement, when the owner's has fallen to maintenance and insurance. Run 3.5% growth on today's average rent for thirty years and the monthly figure roughly trebles. No individual tenancy moves that smoothly, but the direction is not in doubt, and any fair lifetime comparison has to charge the renter for it.
The second cost has just been repriced by Parliament. Until this spring, the deal in England included the landlord's right to end the tenancy for no reason with two months' notice under section 21, and that insecurity was a real cost, paid in school-catchment anxiety and the risk of a forced move at the worst moment. The Renters' Rights Act 2025, in force for new and existing tenancies since 1 May 2026, abolished section 21, converted fixed terms into open-ended periodic tenancies, restricted rent increases to once a year with two months' notice, and gave tenants a route to challenge an above-market rise at tribunal, which can lower the proposed rent but never raise it. Tenants now leave with two months' notice whenever they choose.
What the Act did not do is make renting ownership-grade secure. A landlord can still recover the property to sell it or move close family in, under reformed possession grounds, and the early evidence from the buy-to-let chapter suggests plenty are choosing to sell. Nor did it cap rent levels, only the procedure for raising them. So the fair summary for a 2026 decision is that renting in England is meaningfully more secure than it was a year ago, still less secure than owning, and no cheaper.
That last question deserves its own sentence, because it is the one the monthly comparison always hides. The standard retirement benchmarks assume housing is paid off, and a renter's retirement needs a materially larger pot to fund rent forever. Renting can still win the lifetime comparison, but only when the invested deposit and savings genuinely compound for the decades the owner spends repaying the bank. Renting and spending the difference loses to buying in almost every scenario worth modelling, not because rent is dead money but because nothing was built on the other side of the ledger.
5. Interest rates change the answer, and here is the arithmetic
Every era gets a different rent-vs-buy answer, and the interest rate is the dial doing most of the turning. As of June 2026 the Bank of England base rate stands at 3.75%, and the average quoted fixes sit near 5.68% for two years and 5.63% for five, per Moneyfacts data from the start of the month. Those averages blend all deposit sizes, and a strong deposit buys materially less, but they set the scene. Borrowing money to buy a house currently costs real money, in a way it simply did not between 2009 and 2021.
The cleanest way to see what the rate does is to put it next to the gross rental yield, the annual rent divided by the property price. Divide the ONS average rent, £16,572 a year, by the ONS average price, £268,000, and the national gross yield comes out around 6.2%. That single ratio is the bridge between the two markets, and the comparison against the mortgage rate is the fastest first read on any local market you will find.
The logic runs like this. The gross yield is what the property earns as housing, the rent a renter pays to use it. The mortgage rate is what the bank charges the buyer to hold it. When the mortgage rate sits well below the yield, the owner pays the bank less than the renter pays the landlord for the same roof, and ownership is cheap even before any price growth. When the rate climbs toward and past the yield, the interest alone costs as much as renting, and the entire case for buying rests on house prices rising. The buyer has stopped saving money and started speculating, whether they think of it that way or not.
Plug in the eras and the last two decades reorganise themselves. Through the 2010s, mortgage rates of 2 to 3% sat miles below yields of 5 to 6%, and buying was close to a free lunch for anyone with a deposit, which is why the decade's housing debate was entirely about deposits and never about whether buying made sense. The 2022 to 2023 rate shock pushed fixes above 6% while yields lagged, and for the first time in a generation the interest bill on a typical purchase exceeded the rent on the same home, which is precisely when rent-vs-buy articles returned to British dinner tables. Today's 5.6% fix against a 6.2% national yield is genuinely close, and the answer has stopped being national. In high-yield northern cities, where 7 to 9% gross is available, buying recovers its old advantage. In London, where gross yields run nearer 5%, a 5.6% mortgage still prices many purchases as rate-of-growth bets.
Two refinements stop this heuristic misleading you. First, use the rate you would actually pay, not the national average, because LTV moves it. Second, remember the yield comparison prices only the interest against the rent. The owner still carries maintenance and transaction costs the heuristic ignores, so a dead-heat on rate-versus-yield leans the raw cashflow comparison toward renting before leverage and equity enter the picture.
There is also a softer effect worth naming. High rates do not only raise the cost of owning, they raise the reward for the renter's alternative, because the same environment that prices a fix at 5.6% prices savings and bonds meaningfully above zero too. The 2010s punished renters twice, expensive relative to cheap mortgages and nothing earned on the waiting deposit. The 2020s flipped both signs at once, which is why the calculation feels so different now and why intuitions formed in the 2010s misfire today.
6. The deposit's other life: opportunity cost and the ISA
Every pound in a deposit had other options. The sharpest of them, for a UK saver, is a stocks and shares ISA, where £20,000 a year can grow and be withdrawn with no tax of any kind, per the GOV.UK ISA rules. A couple shelters £40,000 a year between them. Over a decade of saving and growth, the wrapper turns a deposit-sized sum into a portfolio whose gains HM Revenue and Customs (HMRC) never touches, and that portfolio is the renter's answer to the owner's equity.
The first thing to say is that the tax system, unusually, refuses to break the tie. The owner's gain is sheltered too. Private Residence Relief means no capital gains tax on your only or main home, however large the gain, provided you lived in it throughout. So the rent-vs-buy decision in the UK is a contest between two tax-free compounding machines, which is rarer than it sounds. Money invested outside the wrappers, in a general investment account (GIA), pays dividend tax and capital gains tax along the way, so a renter whose deposit outgrows the ISA allowance loses a slice of the advantage, though a couple's double allowance and a few years of patience move most realistic deposits inside the shelter.
What separates the two machines is leverage. The renter's £25,000 earns returns on £25,000. The buyer's £25,000 deposit on a £250,000 home earns house price growth on the entire £250,000. At 3% growth, the renter's portfolio needs to return roughly 30% a year to match the buyer's first-year gain on equity. Stated like that, buying sounds unanswerable, and through every strong housing decade it was. But the same multiplier runs in reverse. A 10% price fall does not cost the leveraged buyer 10%, it costs them their entire deposit, and a fall much past the deposit puts them in negative equity, owing more than the home is worth and unable to sell without writing a cheque. Renters cannot be put in that position by any market move. Leverage is not a return, it is an amplifier, and it amplifies whatever happens to be true.
Two further asymmetries deserve a place in the model. The buyer's leverage shrinks by design, because every repayment converts borrowed exposure into owned equity, so the rocket-fuel years are the early ones. And the renter's compounding is optional in a way the buyer's is not. The mortgage collects itself by direct debit under threat of repossession, which is why economists call owner-occupation forced saving, and it is the only saving scheme much of the population ever completes. The rent-and-invest strategy has no enforcement mechanism. It works on a spreadsheet and fails in a current account, and anyone choosing it is signing up to supply the discipline the bank would otherwise have supplied.
For a first-time buyer still saving, the wrappers stack. The Lifetime ISA's 25% bonus from the upfront-costs chapter is unbeatable on the first £4,000 a year of deposit money for a sub-£450,000 home, and the rest of the deposit pipeline belongs in an ordinary ISA. One dated change to plan around, announced in the Autumn Budget 2025, is that from April 2027 savers under 65 will only be able to put £12,000 of the £20,000 allowance into a cash ISA, with the remainder reserved for investment ISAs. For deposit money needed within a couple of years, cash remains the sane vehicle, so a large cash-saved deposit may want its allowance used before the rule lands.
The compound interest calculator will show you what any deposit becomes at any return over any horizon, which makes the opportunity cost concrete instead of theoretical. And for owners the same logic continues after purchase in a quieter form. Every month, the choice between overpaying the mortgage and investing through the ISA is the rent-vs-buy decision in miniature, a guaranteed saving at the mortgage rate against a hoped-for return in the market. The mortgage overpayment calculator prices one side of it.
7. Houses against shares: what the long run actually says
The rent-and-invest strategy stands or falls on what the investments do, so it is worth asking what the two asset classes have genuinely delivered. The long-run answer is awkward for both tribes.
Take the longest UK series available. Monevator's compilation of the academic data puts UK equities at about 5.3% a year above inflation over the 152 years to 2022. The Barclays Equity Gilt Study, the standard City reference, reads about 5.7% real over its 123-year window. Against that, Nationwide's index back to 1952 shows UK house prices delivering roughly 2% a year above inflation over seventy years, and the Barclays study's property line reads near 1.2% real. On raw price growth, it is not close. Shares roughly double their real value every 13 to 14 years at those rates, houses every 35 or so.
But price indices are not returns, and a fair comparison needs three corrections. Housing pays a dividend the indices ignore, namely the rent an owner stops paying, worth several per cent a year, and the academic "Rate of Return on Everything" study by Jordà and colleagues finds housing's total return lands near equities once that imputed rent is counted. Housing also charges fees the indices ignore, the maintenance, insurance, stamp duty and transaction costs of the last five chapters, which clawed much of that advantage back. And the homeowner buys one asset on one street with ten-to-one leverage, while the equity investor buys thousands of companies across the planet with none, so the risk per pound of exposure is not remotely comparable in either direction.
What settles the argument, or rather usefully unsettles it, is how violently the answer swings by decade.
1999 to 2009, housing won by a street. Halifax data shows the average UK price rising 105% across the decade, while the FTSE 100 ended 2009 below its 1999 peak, a lost decade for UK large-cap prices in which only reinvested dividends kept equity investors above water. Anyone who rented and invested through those years watched their landlord get rich on their behalf.
2016 to 2024, shares won just as clearly. Rathbones' analysis found £100 in the average UK home in 2016 grew to £134 by 2024, trailing inflation in London, while the same £100 in a mainly international equity portfolio reached £174. Their conclusion was blunt, the golden age of UK property investment, the 6.7%-a-year run from 1980 to 2016, is over.
The last twelve months, a coin flip. Prices flat at 0.0%, equities positive but choppy through the spring's gilt-market wobble, and the UBS Global Investment Returns Yearbook, the longest-run study in existence, restating its 126-year finding that equities beat every other asset class in all 21 countries it tracks, while reminding readers that the premium arrives with decade-long droughts.
The planning lesson is not "buy shares" or "buy houses". It is that the identity of the winner depends on which twenty years you happen to live through, and nobody is told in advance. A decision this large should not rest on a returns forecast, yours or anyone's. It should rest on the things you can actually know, your costs, your timeline, your leverage tolerance and your need for security, with the returns treated as a range to stress rather than a number to bank. That is exactly how the worked examples later in this guide handle it.
8. How often you move is the variable that beats the market
Ask the data how long people actually stay put and the gap between tenures is enormous. The English Housing Survey 2024-25 puts the average owner-occupier's residence at 17 years, against 4.7 years for private renters. A fifth of owners have been in the same home for thirty years or more. Only 1% of private renters have. These are different relationships with housing, and the rent-vs-buy maths is wildly different across them.
The reason is that buying carries a fixed toll gate at each end. reallymoving's Cost of Moving Report 2025 prices the average England sale-and-purchase at £17,831 all in, stamp duty, agency at around 1.5% of the sale including VAT, conveyancing both ways, survey, removals. In London the same bundle averages £32,786. Those costs do not care whether you stayed two years or twenty, which means time in the home is the denominator that decides whether they were trivial or ruinous. Spread £18,000 across 17 years and it is £88 a month, a rounding error. Across three years it is £495 a month, which exceeds the maintenance budget and rivals the interest bill, and it was all paid for the privilege of doing the most stressful thing British adults voluntarily do, twice.
So the question "how long will I stay" outranks "what will the market do", because you have actual information about the first and none about the second. The market's contribution over three years is a coin flip centred near zero real growth. The toll gate is a certainty. A buyer who moves on a renter's timeline pays owner's friction at renter's frequency, the worst cell in the whole grid.
The awkward part is that nobody knows their own timeline as well as they think. People buy "forever homes" and divorce, get made redundant, get a job in Leeds, have twins. The English Housing Survey averages include all of those surprises, which is some comfort, but the planning posture that works is to treat your stated horizon with suspicion in proportion to how much of your life is still unsettled. A single 28-year-old two years into a career has renter-shaped uncertainty whatever their intentions, and for them the flexibility renting sells is not a consolation prize, it is the correct purchase. A settled couple with kids enrolled in school and careers anchored to a city have owner-shaped certainty, and for them the toll gate amortises into noise.
There is a respectable rule of thumb buried in all this. On typical current inputs, entry-and-exit friction of 3 to 5% of the property's value needs something like five or more years to amortise comfortably against buying's other advantages, and almost never makes sense inside two or three. The rule is a starting point. Your local yield, your rate and your true horizon move it, which is what the calculator is for.
9. Schools, catchments, and renting next to what you cannot afford to buy
For households with children, the rent-or-buy question often collapses into a different one, how to get an address inside the catchment of a school worth getting into, and the property market has priced that question with brutal efficiency.
Research from the Department for Education (DfE) found that homes near the best-performing 10% of primary schools cost around 8% more than the local average, and around 6.8% more near the best secondaries. In money, that was roughly £18,600 and £15,800 respectively at the time of the study, and nearly £39,000 for top-decile primaries in London. More recent area-level work by Savills in late 2025 found the top tenth of areas for state school performance commanding premiums of as much as 28% over their regional average, though that compares whole areas rather than tight catchments, so treat it as the upper bound of the same effect rather than a like-for-like update.
Read those premiums for what they are. Parents are paying a five-figure, sometimes six-figure, surcharge for a bundle of school access and housing, and the school access part expires when the youngest child leaves the school. The house keeps the premium only for as long as the school keeps its reputation, which is a risk the buyer holds for decades after the catchment stopped mattering to them.
Which opens the play this chapter exists for. Renting buys an address as effectively as owning does. Admissions criteria turn on where the child lives, not on the family's tenure, so a family can rent inside a catchment they could never buy into, paying the catchment premium only through the rent, only for the years it matters. The arithmetic is striking even on the DfE's conservative numbers. An 8% premium on a family home is a five-figure sum of extra purchase price, plus the stamp duty band creep that comes with it, against a rent premium paid for perhaps three or four years around the admissions windows. The renting family keeps their deposit compounding in the ISA throughout and walks away from the premium the day it stops earning its keep.
The play comes with caveats. Schools do scrutinise short-lease, admissions-window rentals, and some explicitly warn against temporary addresses taken to game entry, so the play needs a genuine tenancy, sensibly timed. The Renters' Rights Act helps here, since a periodic tenancy can no longer be ended by section 21 in the middle of an application year, but a landlord selling up can still force a move at an awkward moment, which is exactly the insecurity premium from the renting chapter expressed in its sharpest form. And plenty of families simply want to own the home their children grow up in, which is a preference the spreadsheet should respect rather than override.
The wider point survives the caveats. Location value and ownership value are separable, and renting is the instrument that separates them. The same logic serves the childless. Renting walking distance from work in a city you could not buy into, while your deposit compounds, is the identical trade wearing different clothes.
10. Buy-to-let, briefly
This guide is about your own roof, but the rent-vs-buy question has a third door marked landlord, and enough readers peer through it that it deserves a chapter, if a short one. The summary is that the door has been swinging shut for a decade.
Three tax changes did the work. Since April 2020, the rule known as Section 24 stops individual landlords deducting mortgage interest from rental profits, replacing the deduction with a flat 20% basic-rate credit, so a higher-rate landlord pays tax on interest the lender keeps, and gross rent can push them into higher bands on its way through. Buying the asset now costs the 5% additional-dwellings surcharge on top of standard SDLT since October 2024, which is £10,000 of extra entry tax on a £200,000 terrace before the standard bands start. And selling collects capital gains tax at 18% or 24% on residential gains, reportable and payable within 60 days, against an annual exempt amount now just £3,000. Private Residence Relief, the shelter that makes your own home tax-free, does not apply.
The market has answered. Hamptons' buy-to-let research found UK landlords selling roughly 5.4 homes to owner-occupiers for every 1 they bought in the latest year, against parity as recently as 2021, with investment retreating from London, where landlords bought just 8% of homes sold, toward the high-yield North East, where they bought over 28%. Gross yields of 6 to 9% are genuinely available in northern cities, and for a basic-rate taxpayer with no mortgage, or an incorporated landlord prepared to run a real business, the sums can still work. But after Section 24, voids, management, compliance under the Renters' Rights Act, maintenance from the running-costs chapter and both layers of entry and exit tax, the net return on a leveraged higher-rate landlord's equity frequently trails what the same money earns asleep in a global tracker inside an ISA, with none of the phone calls about boilers.
The relevance to the main question is mostly clarifying. If part of the pull toward buying your own home is "property is a great investment", the houses-against-shares chapter said the record is mixed, and this chapter adds that the state now taxes property investment specifically and hard, while leaving owner-occupation and ISAs alone. The tax system, read as a statement of intent, wants your house to be your home and your investments to be in the wrappers. Fighting that intent is possible. It is just no longer the obvious money it was in 2015.
11. The things the spreadsheet cannot price
Everything so far compounds, amortises or capitalises. The factors in this chapter do none of those things, and several of them will decide your answer anyway, so the sensible move is to name them rather than pretend the model is complete.
Security has a value above its price. Chapter 4 covered what the Renters' Rights Act changed, but even post-reform, a renting household lives with the possibility that a landlord's sale forces a move, and a family seven years into a neighbourhood feels that possibility differently from a graduate seven months into one. Ownership with a paid mortgage is the only tenure in Britain that cannot be ended by anyone else's decision. For some people that sentence is worth more than every basis point in this article, and they are not wrong, they are just pricing something the calculator does not sell.
Control compounds quality of life. Owners knock through walls, plant trees that take a decade to amount to anything, keep dogs without permission, and fix the bathroom to their own standard on their own schedule. The Renters' Rights Act gives tenants a right to request a pet that cannot be unreasonably refused, which is progress, but request is the operative word, and magnolia walls remain the law of the rented land. Thirty years is a long time to live somewhere provisionally.
Ownership carries its own stresses. The repair bills covered earlier arrive without warning and without a landlord to absorb them. Negative equity, when it visits, traps people in homes, jobs and sometimes marriages they had planned to leave. Remortgaging at the wrong moment, as a million households discovered in 2023, can reprice a family's biggest outgoing by hundreds of pounds in a month. The freedom of renting, the ability to solve any housing problem with two months' notice, is a real asset that owners end up repurchasing later in life at full price when they downsize.
Identity is doing more work than anyone admits. British culture treats the deposit as a rite of passage and renting past forty as a failure state, and that pressure pushes people into purchases the numbers in this guide would have talked them out of. It also works the other way, with committed renters treating a mortgage as surrender. Neither instinct is a financial argument. The useful discipline is to run the model first, then ask what the feelings are worth in pounds, rather than letting the feelings write the inputs.
A good decision uses both ledgers. Run the money straight, then put the unpriceables on the table and see which way they push. When the financial gap between renting and buying is small, as it currently is nationally, the unpriceables deserve to win. When the gap is large, it takes a strong life reason to overrule it, and "everyone says rent is dead money" is not one.
12. Worked example: better to buy
Time to run the machine, and to fix the flaw in most rent-or-buy comparisons before it can start. The two worked examples in this guide are the same person. A 31-year-old engineer, same salary, same £1,100 rent, same £250,000 target home, same 25-year horizon. Between this chapter and the next, exactly three dials move, the mortgage rate, the size of the deposit, and the return the invested money earns. Whatever flips the verdict, it cannot be the person.
One rule before the numbers, because it changes how to read every figure. Everything here is inflation-adjusted. Assume inflation of around 2.5%, strip it out of every growth and return assumption, and read every output as today's money. House price growth of 0% therefore does not mean a frozen market, it means prices rising with inflation and no faster, which is slightly kinder than what the UK market delivered over the last year. An investment return of 7% real is roughly 10% in nominal terms, the ballpark global equities have averaged over recent decades, while 4% real is a sober figure for a balanced portfolio. The mortgage rate stays as written on the contract, and the model counts the outstanding debt at face value rather than letting inflation shrink it, which shades every result mildly against the buyer.
| Input | Value |
|---|---|
| House price | £250,000 |
| Deposit | £25,000, so 90% LTV and £225,000 borrowed |
| Mortgage rate | 4.5%, over a 30-year term |
| Monthly rent | £1,100 |
| House price growth | 0% real (prices track inflation) |
| Investment return | 4% real (roughly 6.5% nominal) |
| Buyer type | First-time buyer |
| Horizon | 25 years |
That rent on that house is a 5.3% gross yield, around the national average. The 4.5% rate is what a strong application gets today, and first-time buyer relief takes the stamp duty on a £250,000 purchase from £2,500 to zero. To reproduce these figures in the calculator, set the maintenance, service charge, one-off buying and selling-cost fields to zero and rent growth to zero, since everything here is in today's money with rent held flat. The calculator ships with realistic defaults for all of them, worth switching back on for your own situation. The closing paragraph of this chapter spells out exactly what those zeroes leave out and which way each one leans.
The calculator prices the mortgage at £1,140 a month, £40 more than the rent. That near-tie decides the renter's fate in this scenario. The renter invests the £25,000 deposit at 4% real, but the monthly difference available on top is £40, and £40 a month does not build an estate. Meanwhile every mortgage payment converts a slice of debt into equity, in a home whose real value is simply holding steady.
Buying overtakes renting in year 1 and never looks back. At year 25 it reads £188,849 against £87,457 in today's money, a buyer advantage of £101,392. Notice what is producing the win, because it is not speculation. In a market that only tracks inflation, the entire buyer lead is amortisation, the forced-saving engine described earlier, grinding the loan down month after month.
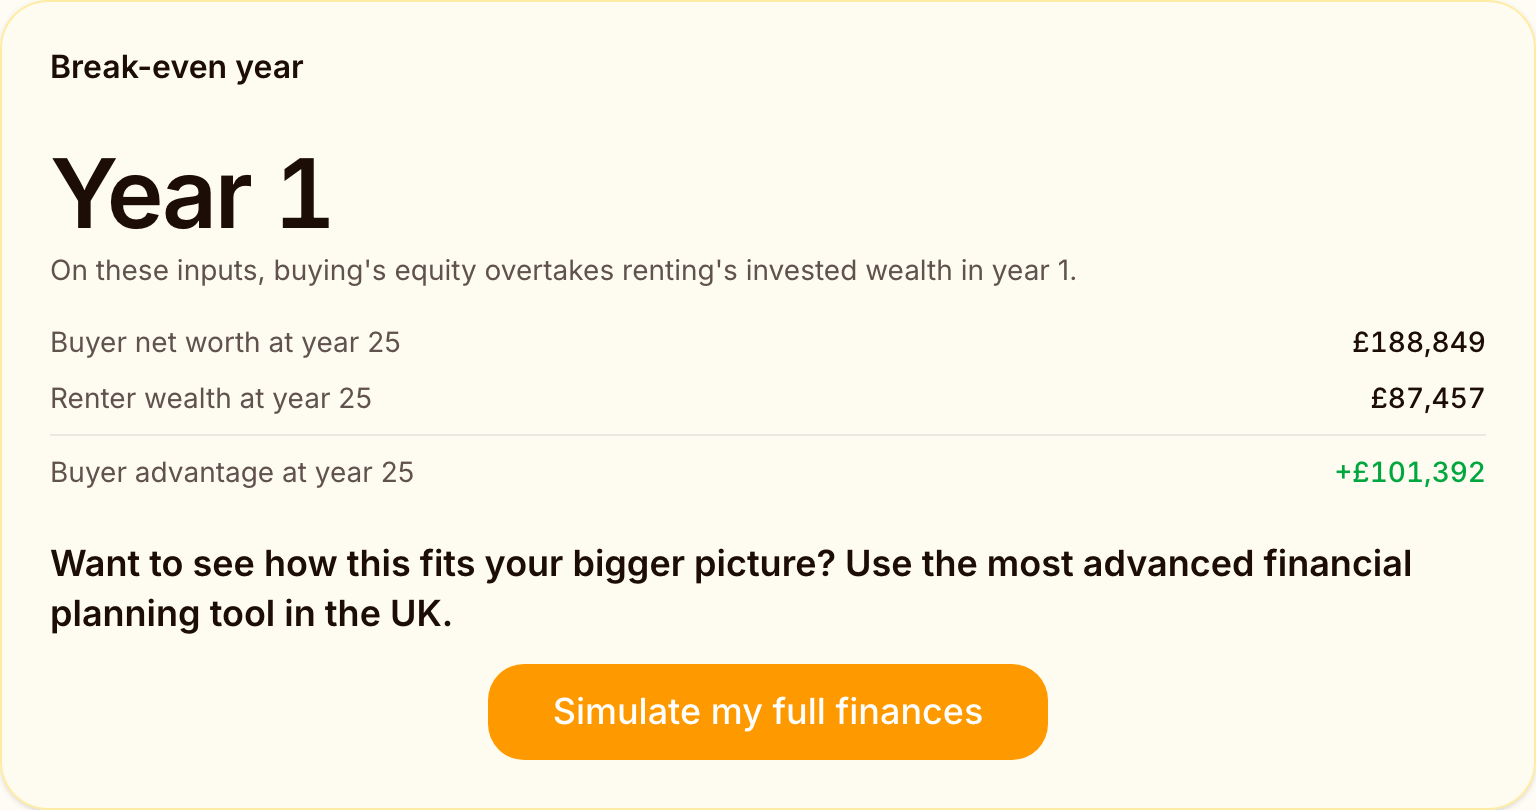
What these two examples strip out cuts both ways, and it is worth saying once for both. We set the ownership running costs to zero, no maintenance, insurance or purchase fees, call it £2,500 to £3,000 a year in reality, which flatters the buyer. We hold rent flat in today's money, which is roughly fair, though a fixed nominal mortgage payment actually shrinks in real terms while rent does not, which flatters the renter. And the model counts the mortgage debt at full face value, which leans against the buyer again. On a £101,392 margin, none of these move the verdict. On the knife-edge rows of the next chapter's grid, they easily could, which is the right way to read any row with a five-figure margin. The calculator includes every one of these costs by default, and rent growth too, so when you model your own numbers the comparison is fuller than the deliberately bare version here.
13. Worked example: better to rent
Same engineer. Same salary, same £1,100 rent, same £250,000 home, same horizon, same inflation adjustment. Now turn the three dials.
| Dial | Better to buy | Better to rent |
|---|---|---|
| Mortgage rate | 4.5% | 6% |
| Deposit | £25,000 (10%) | £62,500 (25%) |
| Investment return | 4% real | 7% real (roughly 10% nominal) |
None of the new settings needs imagination. A 6% mortgage is what 2023 actually quoted and what a weaker application can still be quoted today. The bigger deposit is the same person five saving years later. And the investment dial is the difference between a cautious balanced portfolio and a global equity tracker having the kind of run it has had over recent decades.
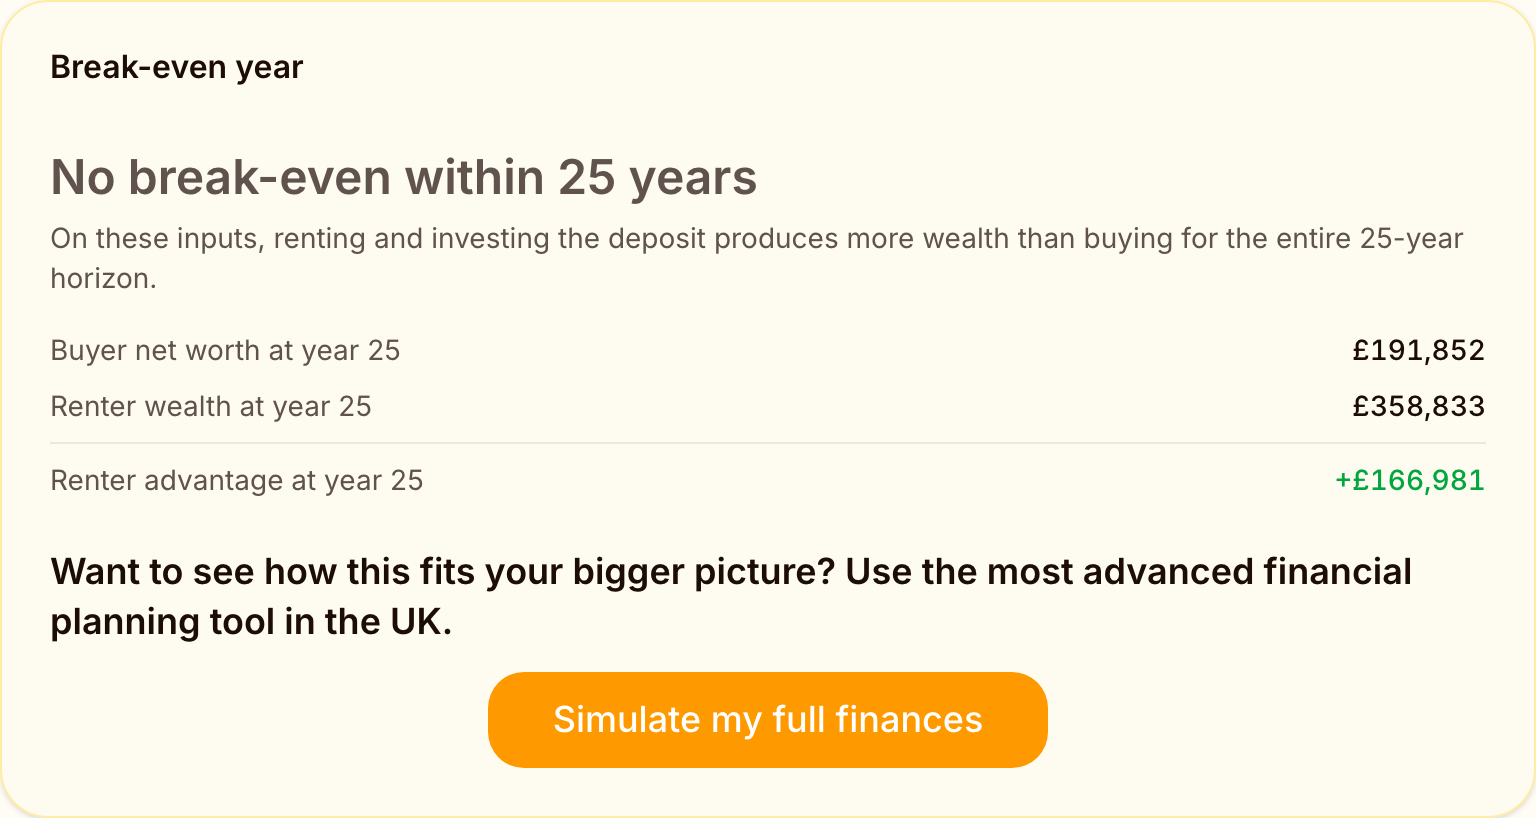
Turned together, the dials produce a verdict as one-sided as the base case, in the opposite direction. The mortgage on £187,500 at 6% costs £1,124 a month, almost exactly the rent, so the monthly contest is a dead heat and the fight is between two lump sums. The buyer puts £62,500 into bricks that track inflation and grinds down a 6% loan. The renter puts the same £62,500 to work at 7% real. The calculator finds no break-even within 25 years, and at year 25 it reads £358,833 renting against £191,852 buying, a renter advantage of £166,981 in today's money.
The grid below is the full stack, every combination of the three dials, always the same person, home and rent.
| Mortgage rate | Deposit | Investment return | Buyer | Renter | Verdict |
|---|---|---|---|---|---|
| 4.5% | 10% | 4% real | £188,849 | £87,457 | Buy, by £101,392 |
| 4.5% | 10% | 7% real | £188,849 | £168,205 | Buy, by £20,644 |
| 4.5% | 25% | 4% real | £276,984 | £166,615 | Buy, by £110,369 |
| 4.5% | 25% | 7% real | £320,830 | £339,215 | Rent, by £18,385 |
| 6% | 10% | 4% real | £180,223 | £196,056 | Rent, by £15,833 |
| 6% | 10% | 7% real | £180,223 | £337,894 | Rent, by £157,671 |
| 6% | 25% | 4% real | £191,852 | £179,170 | Buy, by £12,682 |
| 6% | 25% | 7% real | £191,852 | £358,833 | Rent, by £166,981 |
Read the dials one at a time. The investment return is the heavyweight. At 4% real, buying takes three rows of four. At 7% real, renting takes three of four, and the only hold-out is the cheap-mortgage, small-deposit row where the renter has the least capital working. The rate dial swings six figures. On the small deposit at cautious returns, moving from 4.5% to 6% turns a £101,392 buy into a £15,833 rent, a £117,000 swing from one and a half percentage points. The deposit dial cuts both ways, which surprises people. At a 6% mortgage and 4% returns, the bigger deposit rescues the purchase, because retiring expensive debt beats a weak portfolio. At 7% returns the same lump sum serves the renter instead, because it earns more in the market than it saves on the mortgage. The deposit is not pro-buying or pro-renting. It amplifies whichever side gives it the better rate of return. A realism note for the wild. In today's LTV pricing the 10% deposit usually pairs with the higher rate and the 25% deposit with the lower one, so the grid's kindest and harshest buying rows are both rarer than the middle ones.
One more row deserves its own table, a realistic middle that sits inside none of the corners. Take a 4% mortgage, the kind of fix a strong deposit could land if rates keep drifting down, and roughly where pre-2022 normality sat. Take a £60,000 deposit, 24% of the price. And take 8% nominal investment returns, a common planning figure for a global tracker, which is 5.5% real on this guide's inflation assumption.
| Mortgage rate | Deposit | Investment return | Buyer | Renter | Verdict |
|---|---|---|---|---|---|
| 4% | 24% (£60,000) | 5.5% real (8% nominal) | £325,673 | £228,804 | Buy, by £96,869 |
This row rewards a second look, because it is the one where the monthly arithmetic flips. At 4%, the mortgage costs £907 a month, £193 less than the rent, the only scenario in this guide where buying is cheaper month to month. The calculator invests that £193-a-month surplus on the buyer's side, exactly as it invests the renter's surplus when renting is the cheaper option, and over 25 years at 5.5% real that stream compounds into roughly the difference between bare equity and the £325,673 buyer figure above. That is why a row most people's instinct files under renting, low rate, healthy deposit, strong returns, in fact lands as a buying win of £96,869. The general lesson travels beyond this row. Whenever the mortgage payment undercuts the rent, the owner is quietly force-fed a monthly surplus to invest, and that channel, cheap borrowing plus a gap owners pour into the market or the mortgage anyway, is most of how the low-rate 2010s made owners rich.
House price growth is pinned at inflation across the whole grid, deliberately, because it is the one dial nobody controls. Hand housing its long-run 2% real instead and buying takes seven rows of eight. Hold it at the negative real growth of the last twelve months and renting sweeps further still. That dial remains the biggest one, which is exactly why it pays to know the verdict on your own inputs before betting on it.
Neither headline outcome says anything about you, which is precisely the point. The same person, in the same flat, looking at the same house, is six figures better off buying under one set of conditions and six figures better off renting under another, and the conditions are not exotic, they are this decade's actual range. The row you live in is decided by your mortgage quote, your savings account and your fund's factsheet.
14. The horizon decides: 25 years against a lifetime
Both worked examples, better to buy and better to rent, stopped at year 25, and that stopping point was a choice, not a fact. Stretch the same two scenarios further, toward the end of a working life and beyond, and the numbers keep moving. Here is what the calculator reports when the only input that changes is the horizon.
| Horizon | Better to buy: buyer | Better to buy: renter | Better to rent: buyer | Better to rent: renter |
|---|---|---|---|---|
| Year 25 | £188,849 | £87,457 | £191,852 | £358,833 |
| Year 40 | £414,820 | £161,512 | £445,144 | £993,541 |
| Year 50 | £658,793 | £239,078 | £829,020 | £1,954,445 |
These long horizons are where buying's structure finally tells, and the key to reading them is the year-30 mark. Both versions of our engineer make their last mortgage payment in year 30, and from year 31 the roughly £1,130 a month that used to service the loan is free. The calculator invests it on the buyer's side at the same return the renter earns, because once the mortgage ends, owning costs less every month than renting and the model feeds the difference into the buyer's portfolio. That is why the buyer columns do not stall at the £250,000 value of a paid-off home, they keep climbing: the better-to-buy engineer's freed payments at 4% real lift the buyer figure to £658,793 by year 50, and even the better-to-rent engineer, investing the freed payment at 7% real, reaches a buyer position of £829,020. You can sanity-check the freed-payment arithmetic in the compound interest calculator.
What stretching the horizon does not do here is flip either verdict, and that is the more honest lesson. The better-to-buy case wins from year 1 and only widens, by £253,308 at year 40 and £419,715 at year 50. The better-to-rent case is the stubborn one: a £62,500 deposit compounding at 7% real is so powerful that even with the owner now investing every freed payment, renting still finishes £1.1m ahead at year 50. High real returns on a large invested deposit are genuinely hard for bricks to beat over any horizon, which is exactly why the investment-return dial dominated the grid.
But there is a real-life cost the standalone numbers cannot price, and it favours the owner. The renter's payment never stops. Rent here is flat in today's money, which is fair across a mortgage term but generous to the renter across a lifetime, since real rents have historically risen with wages. And from year 31 the owner pays only maintenance and insurance while the renter keeps finding £13,200 a year in today's money, indefinitely, landing in exactly the decades when income has shrunk to a pension. Across a 30-year retirement that is roughly £396,000 of rent the owner never pays. The standard retirement budgets are built on the assumption of a paid-off home, which is why a renter's retirement needs a materially larger pot. A standalone rent-vs-buy projection cannot see your pension, the ISA you stop funding while you rebuild savings after the purchase, or the tax around either, and the retirement guide prices the housing gap properly.
So the long-horizon truth is that buying's advantages are back-loaded into the mortgage-free decades, exactly the stretch a 25-year horizon cuts off, but they are not automatic: a large deposit earning equity-grade real returns can keep renting ahead for life, while a cautious portfolio hands the win to the owner once the loan is gone. A scenario where renting wins the 25-year race and owning wins the 50-year one is a common shape, not a contradiction, and the crossover usually sits somewhere in the owner's mortgage-free decades. The proper tool for deciding which shape is yours is not a longer horizon on a standalone calculator, it is a full-household projection that retires you, ends the mortgage, grows the rent and pays your pension, which is what the what-if simulator is for.
Buying early against buying late
The same horizon logic reframes a question every renter eventually asks, which is whether waiting is costing them.
What buying early actually buys is more years on the right side of the asymmetry. Buy at 30 and the mortgage is gone by 60, leaving a decade of freed payments to invest before pension age and a rent-free retirement after it. Buy at 45 on the same 30-year term and the loan runs to 75, well past state pension age, which most lenders will not write. The practical menu at 45 is a shorter term with a sharply higher monthly payment, or a retirement that starts with housing debt still on the books. Each year of delay converts one future mortgage-free year into a mortgage year, at the most expensive end of life to be carrying it.
What waiting actually buys is real too. A bigger deposit drops you into cheaper LTV bands, so the late buyer borrows less at a better rate. The waiting years add certainty about where life settles, which earlier emerged as the single most valuable input in the whole decision. And when the waiting deposit is genuinely invested while the housing market idles, the wait turns a profit, which is not hypothetical. A renter who held a global tracker instead of a London flat from 2016 to 2024 ended the period able to buy more house than when they started, per the Rathbones figures quoted earlier.
The trap is delay by drift. Waiting pays when the deposit compounds in a stocks and shares ISA and the wait has a purpose, a market you distrust, a life still in motion, a deposit racing toward a cheaper LTV band. It loses, slowly and invisibly, when the deposit sits in low-interest cash while rents rise and birthdays accumulate, eroding both the investment case for waiting and the mortgage-term case for buying. Delay is a position, and like any position it needs to be held deliberately or closed.
15. How to actually decide
The first answer is the practical one. Put your details into a thorough, UK-specialised financial calculator and quickly work out the best situation for you. Every situation is different. The same person was six figures better off buying in one row of the grid and six figures better off renting in another, and no article, this one included, can know which row you live in. A tool that holds your real rent, deposit, mortgage quote and savings, and that understands stamp duty, ISAs and UK tax, settles in minutes what the general debate never will. Get started with A Few Quid.
If you want to interrogate the decision yourself first, the rest of this guide reduces to a short list of questions. Answer them straight and the decision mostly makes itself.
How long will you genuinely stay? Under three years, renting wins on friction alone, almost regardless of everything else. Past seven, buying's toll gate amortises away and its structural advantages, leverage, forced saving, an eventual end to housing payments, take over. In between, the other questions decide.
What is the yield where you are buying? Rent on the target home, annualised, divided by its price. Above your mortgage quote, the rate environment favours owning. Below it, the interest alone outprices the rent and the purchase is a growth bet that needs to be named as one.
What would the renting version of you actually have working? When rent and mortgage sit near parity, the monthly difference is pocket change and the contest is between the buyer's forced amortisation and the renter's existing capital. The better-to-buy example's renter had £25,000 working at cautious returns and lost by six figures. The better-to-rent example's renter had £62,500 working at equity-grade returns and won by six figures. The fuel is the capital and its return, far more than the monthly gap.
Would you actually invest the difference? The strategy requires the deposit in a stocks and shares ISA and the monthly gap following it, on direct debit, for decades. Anyone who answers "probably" has answered no, and for them buying's forced saving is worth more than any spreadsheet edge.
Which failure could you not live with? Buying's worst case is negative equity in a home you need to leave. Renting's worst case is a forced move at a bad time and rent rising through a retirement you funded for a paid-off life you never bought. People feel these risks very differently, and the feeling belongs in the decision.
Then run it, with your numbers, stressed in both directions. The rent vs buy calculator takes two minutes per scenario. The what-if simulator places the winner inside your full financial life, and the dashboard keeps the projection alive as rates, rents and your own plans move, because this is not a decision you make once. The renter who checks the maths annually catches the year the yield, the rates or a swollen deposit flip the answer. The 2026 picture, flat prices, rents compounding, rates near yields, is closer to balanced than Britain has seen in years, which makes the personal inputs, not the national ones, the whole game.
About the author and this calculator
I am Mike Gallagher, a software engineer based in the UK, and I built A Few Quid because the financial tools I could find kept answering questions like this one with a verdict instead of a model. Rent versus buy is the worst offender of the lot. Every existing calculator I tried either assumed American tax rules, ignored stamp duty and moving friction entirely, or hard-coded the house price growth that decided the answer. I wanted to see my own numbers, my rent, my deposit, my city's prices, projected forward under assumptions I could change and stress, and I wanted the tool to show its working.
A Few Quid is that tool. It runs UK-specific projections on your real inputs, from a single rent-vs-buy break-even to a full household plan with salary, pension, ISA and mortgage interacting over decades. I am not a financial adviser, and A Few Quid is not authorised by the FCA, which I state plainly because it matters. The app is a calculator for exploring your own numbers, not a source of personal advice. For a decision the size of a house, paid professional advice is worth its fee.
If this guide leaves you with one habit, make it this. Treat every rent-vs-buy verdict you encounter, including the worked examples above, as someone else's inputs wearing a conclusion. The figures here are accurate as of June 2026 and sourced below, but rates move, reliefs lapse, rents compound and your life is not the example. Run the numbers yourself, stress them until they confess, and then decide. That is the only version of this answer worth having.
FAQ
Is rent really dead money?
No more than mortgage interest is. A renter pays for housing and walks away with nothing. A buyer pays interest, maintenance, insurance, stamp duty and transaction fees, and walks away with equity. Only the repayment part of a mortgage builds wealth. In the early years of a long mortgage most of the payment is interest, so both households are mostly paying for the roof, not investing. The real comparison is the total unrecoverable cost on each side, plus what the renter's deposit earns invested elsewhere.
Do first-time buyers pay stamp duty in England?
Not on most homes. Since April 2025, first-time buyer relief means no Stamp Duty Land Tax up to £300,000 and 5% on the portion between £300,001 and £500,000. Above £500,000 the relief disappears entirely and standard rates apply to the whole price. Scotland and Wales run their own systems with different thresholds, so check the rules for the nation where the property sits.
How do interest rates change the rent vs buy decision?
The mortgage rate is the price of borrowing to own, so when it rises the unrecoverable cost of buying rises with it. A useful first check is to compare the mortgage rate against the property's gross rental yield, which is the annual rent divided by the price. When the mortgage rate sits well above the yield, renting the same property costs less per year than the interest alone, and the case for buying leans on house price growth. When the rate sits below the yield, the owner is paying less to hold the asset than the renter pays to use it.
Is buying always better over 25 years?
No. Buying tends to win on long horizons because leverage amplifies even modest house price growth and the mortgage eventually ends. But the outcome flips on the inputs. With house prices only keeping pace with inflation, a high mortgage rate, and a healthy deposit invested at equity-style returns instead, renting and investing can finish six figures ahead over 25 years. The plain answer is that the winner depends on numbers you can estimate but not know, which is why running your own ranges matters more than reading anyone's verdict.
Does the Lifetime ISA still make sense for a house deposit?
For most first-time buyers saving toward a home under £450,000, yes. You can pay in up to £4,000 a year and the government adds 25%, up to £1,000 a year. The catches are real, though. The £450,000 property cap has been frozen since 2017, and withdrawing for any other reason costs 25% of the pot, which claws back more than the bonus. The government consulted in early 2026 on a simpler replacement product, but the Lifetime ISA remains the live scheme today.
Did the Renters' Rights Act make renting more secure?
Materially, yes. Since 1 May 2026, section 21 no-fault evictions are abolished in England, fixed-term tenancies have converted to open-ended periodic ones, and rent rises are limited to once a year with two months' notice and a route to challenge at tribunal. A landlord can still sell up or move back in under the reformed possession grounds, so renting is not ownership-grade security. But the gap has narrowed from where it stood for the previous thirty years.
Is buy-to-let still worth it in 2026?
The tax treatment has turned sharply against the small landlord. Mortgage interest only earns a 20% credit rather than full deduction, the stamp duty surcharge on additional properties is 5%, and capital gains tax of up to 24% is due within 60 days of sale. Hamptons found landlords selling 5.4 homes for every 1 they bought in the latest year. Yields of 6 to 7% gross are still on offer in parts of the North, but after tax, voids and management it is a leveraged small business, not a passive investment.
How long do I need to stay in a home for buying to beat renting?
The friction costs of buying and later selling, which include stamp duty, conveyancing, surveys, agent fees and removals, average around £18,000 for an England sale-and-purchase according to reallymoving's 2025 report. Those costs are fixed regardless of how long you stay, so a short stay spreads them over few years and a long stay makes them trivial. As a rough rule the maths starts favouring purchase somewhere past the five-year mark on typical inputs, and almost never inside two or three years.
Glossary
- Stamp Duty Land Tax (SDLT)
- The tax on buying property in England and Northern Ireland, charged in bands. From April 2025 the bands are 0% to £125,000, 2% to £250,000, 5% to £925,000, 10% to £1.5m and 12% above. First-time buyers pay nothing up to £300,000 on homes costing £500,000 or less. Scotland and Wales levy their own equivalents.
- Gross rental yield
- Annual rent divided by property price, before any costs. It is the bridge between the rental and sales markets. Dividing the ONS average rent by the ONS average house price gives a UK figure around 6%, with London lower and the North higher.
- Private Residence Relief
- The rule that exempts your only or main home from capital gains tax when you sell it, provided you lived in it throughout ownership and did not let it out or use part exclusively for business. It is the largest tax advantage of owner-occupation.
- ISA (Individual Savings Account)
- A UK tax wrapper in which growth, dividends, interest and withdrawals are all tax-free. The annual allowance is £20,000. A stocks and shares ISA is the standard vehicle for long-term investing outside a pension.
- Lifetime ISA (LISA)
- An ISA variant for first homes and retirement. Savers aged 18 to 39 can open one and pay in £4,000 a year, and the government adds a 25% bonus. The home must cost £450,000 or less, and unauthorised withdrawals are charged 25%, which more than removes the bonus.
- Loan-to-value (LTV)
- The mortgage as a percentage of the property price. A £225,000 loan on a £250,000 home is 90% LTV. Lower LTV bands unlock cheaper mortgage rates, which is why the size of the deposit changes the cost of borrowing, not just its amount.
- Equity
- The part of the home you actually own, equal to the property's value minus the outstanding mortgage. It grows from two sources, repaying the loan and any rise in the property's price, and it shrinks when prices fall.
- Negative equity
- Owing more on the mortgage than the home is worth, which happens when prices fall faster than the loan is repaid. It traps owners because selling would not clear the debt. It is the downside face of leverage.
- Section 21
- The former no-fault eviction route in England, which let landlords end a tenancy without giving a reason. Abolished from 1 May 2026 by the Renters' Rights Act 2025, which converted tenancies to open-ended periodic agreements with reformed possession grounds.
- Section 24
- Shorthand for the finance-cost restriction that stops individual landlords deducting mortgage interest from rental profits. Since April 2020 they receive only a 20% basic-rate credit, so higher-rate landlords pay tax on income that goes straight to the lender.
- Price-to-rent ratio
- Property price divided by annual rent, the inverse of gross yield. At the current UK averages it sits near 16, meaning a home costs about 16 years of rent. A high ratio flatters renting, a low ratio flatters buying.
- Opportunity cost
- What the money tied up in a deposit and purchase costs could have earned elsewhere. A deposit locked into bricks earns house price growth on a leveraged basis. The same money in a stocks and shares ISA earns market returns tax-free. The difference between those two paths is the hidden price of whichever you choose.
- Service charge
- The annual fee leaseholders pay for maintaining shared parts of a building. Hamptons put the England and Wales average for flats at £2,405 a year in 2025, up by about a third in five years. It is a running cost of ownership that renters never see directly.
Sources
- Stamp Duty Land Tax: residential property rates — GOV.UK
- Private rent and house prices, UK: May 2026 — ONS
- Monetary Policy Summary and Minutes, April 2026 — Bank of England
- Individual Savings Accounts (ISAs) — GOV.UK
- Lifetime ISA — GOV.UK
- Tax when you sell your home (Private Residence Relief) — GOV.UK
- Capital Gains Tax rates — GOV.UK
- English Housing Survey 2024-25, Chapter 3: housing history — GOV.UK
- Cost of Moving Report 2025 — reallymoving
- House prices and schools (2017) — Department for Education
- 2025 Service Charge Index — Hamptons
- Buy-to-let report: has the door closed? — Hamptons
- Historical UK asset class returns — Monevator
- UK house prices since 1952 — Nationwide
- Research shows golden age of UK property investment is over — Rathbones
- Renters' reform in England: what's happening and when? — House of Commons Library
- Leasehold reform in England and Wales — House of Commons Library
- Global Investment Returns Yearbook 2026 summary — UBS
Related reading
- Mortgage overpayment or invest? — How to weigh guaranteed interest saved against potential investment growth.